TiDB Dashboard Instance Profiling - Continuous Profiling
Continuous Profiling allows collecting performance data continuously from each TiDB, TiKV and PD instance. The collected performance data can be visualized as FlameGraph or DAG.
With these performance data, experts can analyze resource consumption details like instance's CPU and memory, to help pinpoint sophisticated performance problems at any time, such as high CPU overhead, high memory usage, process stalls, and so on. Even for problems cannot be reproduced, experts can dig deep into the problem by viewing the historical performance data collected at that moment. In this way, MTTR can be reduced effectively.
Compare with Manual Profiling
Continuous Profiling is an enhanced feature of Manual Profiling. They can be both used to collect and analyze different kinds of performance data for each instance. Differences between them are as follows:
- Manual Profiling only collects performance data for a short period of time (for example, 30 seconds) at the moment you initiate the profiling, while Continuous Profiling collects data continuously when it is enabled.
- Manual Profiling can only be used to analyze current occurring problems, while Continuous Profiling can be used to analyze both the current and historical problems.
- Manual Profiling allows to collect specific performance data for specific instances, while Continuous Profiling collects all performance data for all instances.
- Continuous Profiling stores more performance data, therefore it takes up more disk space.
Supported performance data
All performance data in Manual Profiling is collected.
CPU: The CPU overhead of each internal function on TiDB, TiKV, TiFlash, and PD instances
Heap: The memory consumption of each internal function on TiDB, TiKV, and PD instances
Mutex: The mutex contention states on TiDB and PD instances
Goroutine: The running state and call stack of all goroutines on TiDB and PD instances
Access the page
You can access the Continuous Profiling page using either of the following methods:
After logging in to TiDB Dashboard, click Advanced Debugging > Profiling Instances > Continuous Profiling in the left navigation menu.
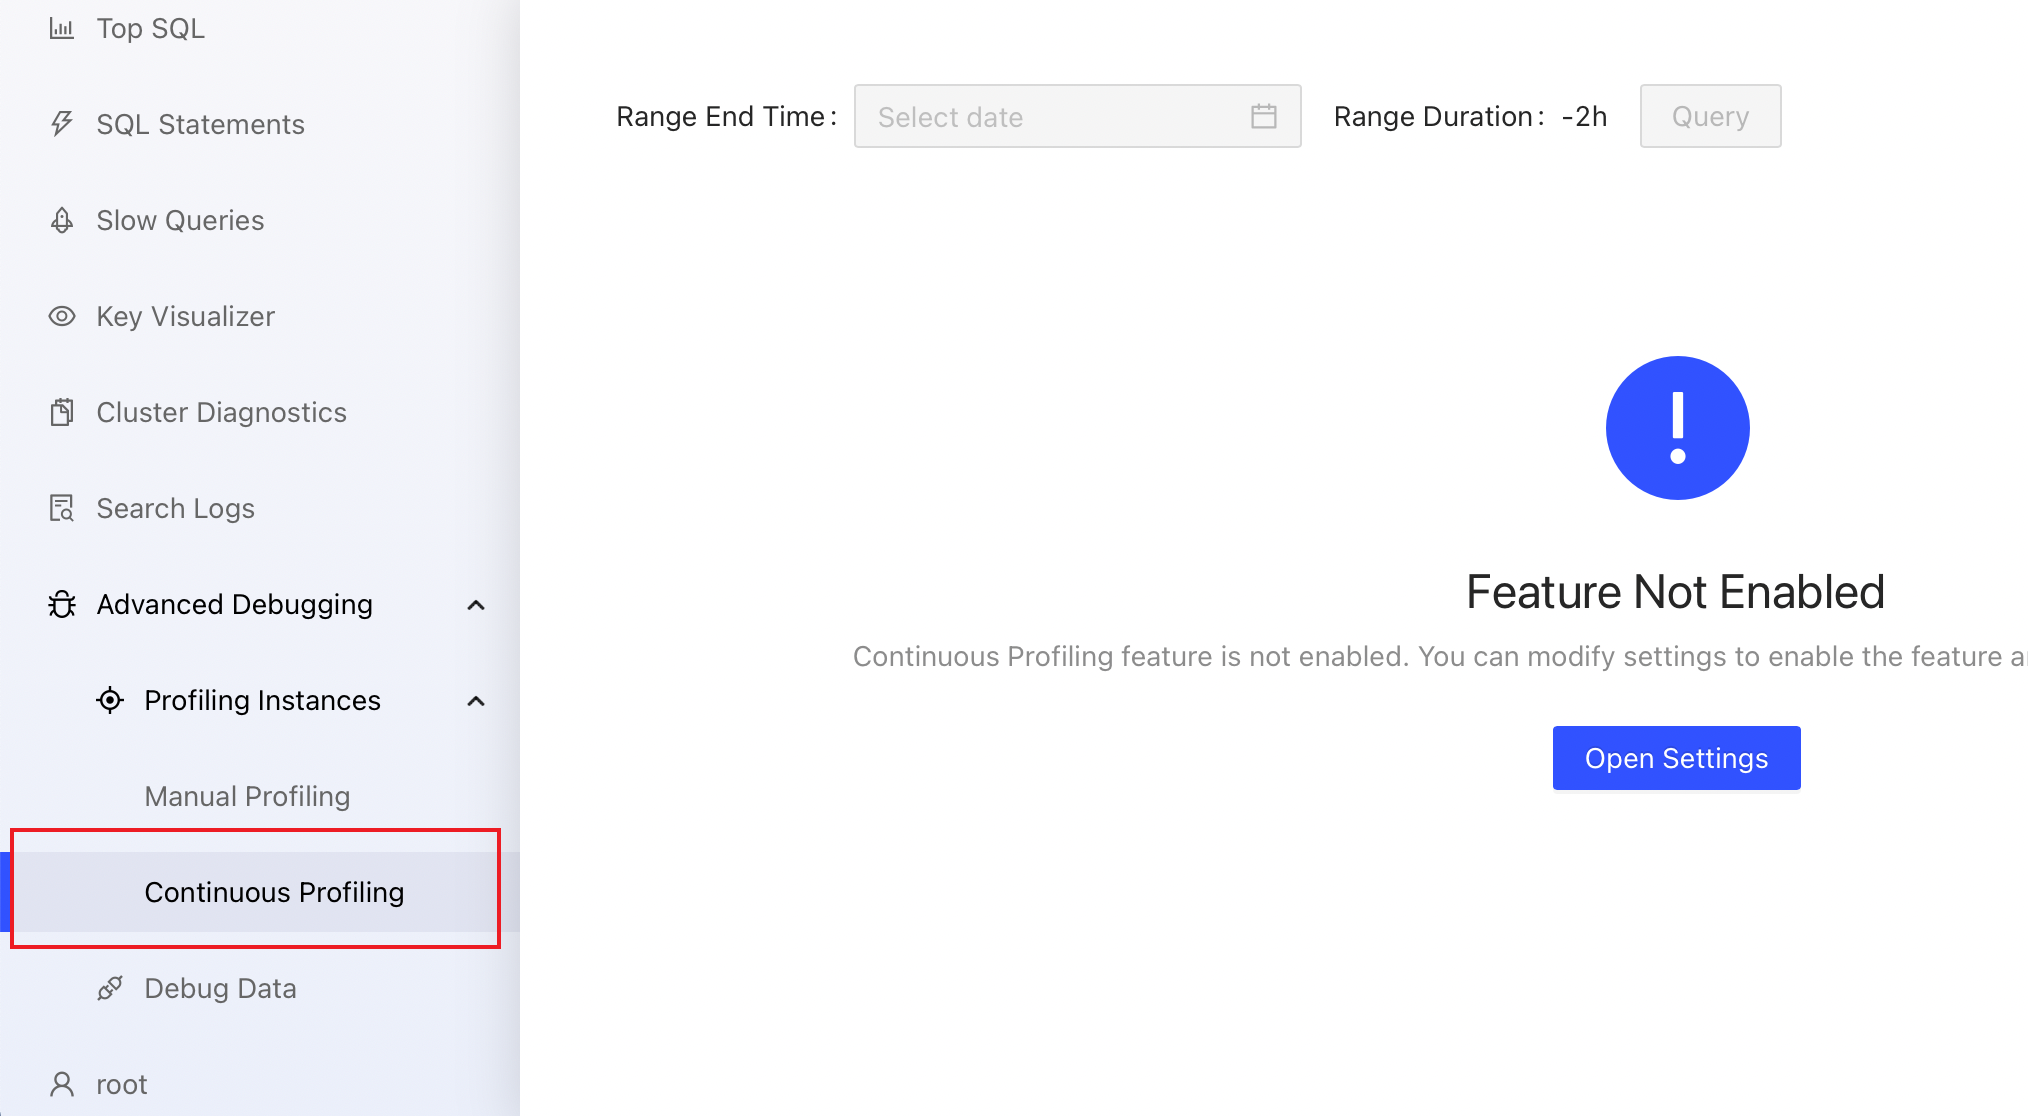
Visit http://127.0.0.1:2379/dashboard/#/continuous_profiling in your browser. Replace
127.0.0.1:2379with the actual PD instance address and port.
Enable Continuous Profiling
After enabling Continuous Profiling, you can have performance data continuously collected in the background without keeping the web pages always active. Data collected can be kept for a certain period of time and expired data is automatically cleared.
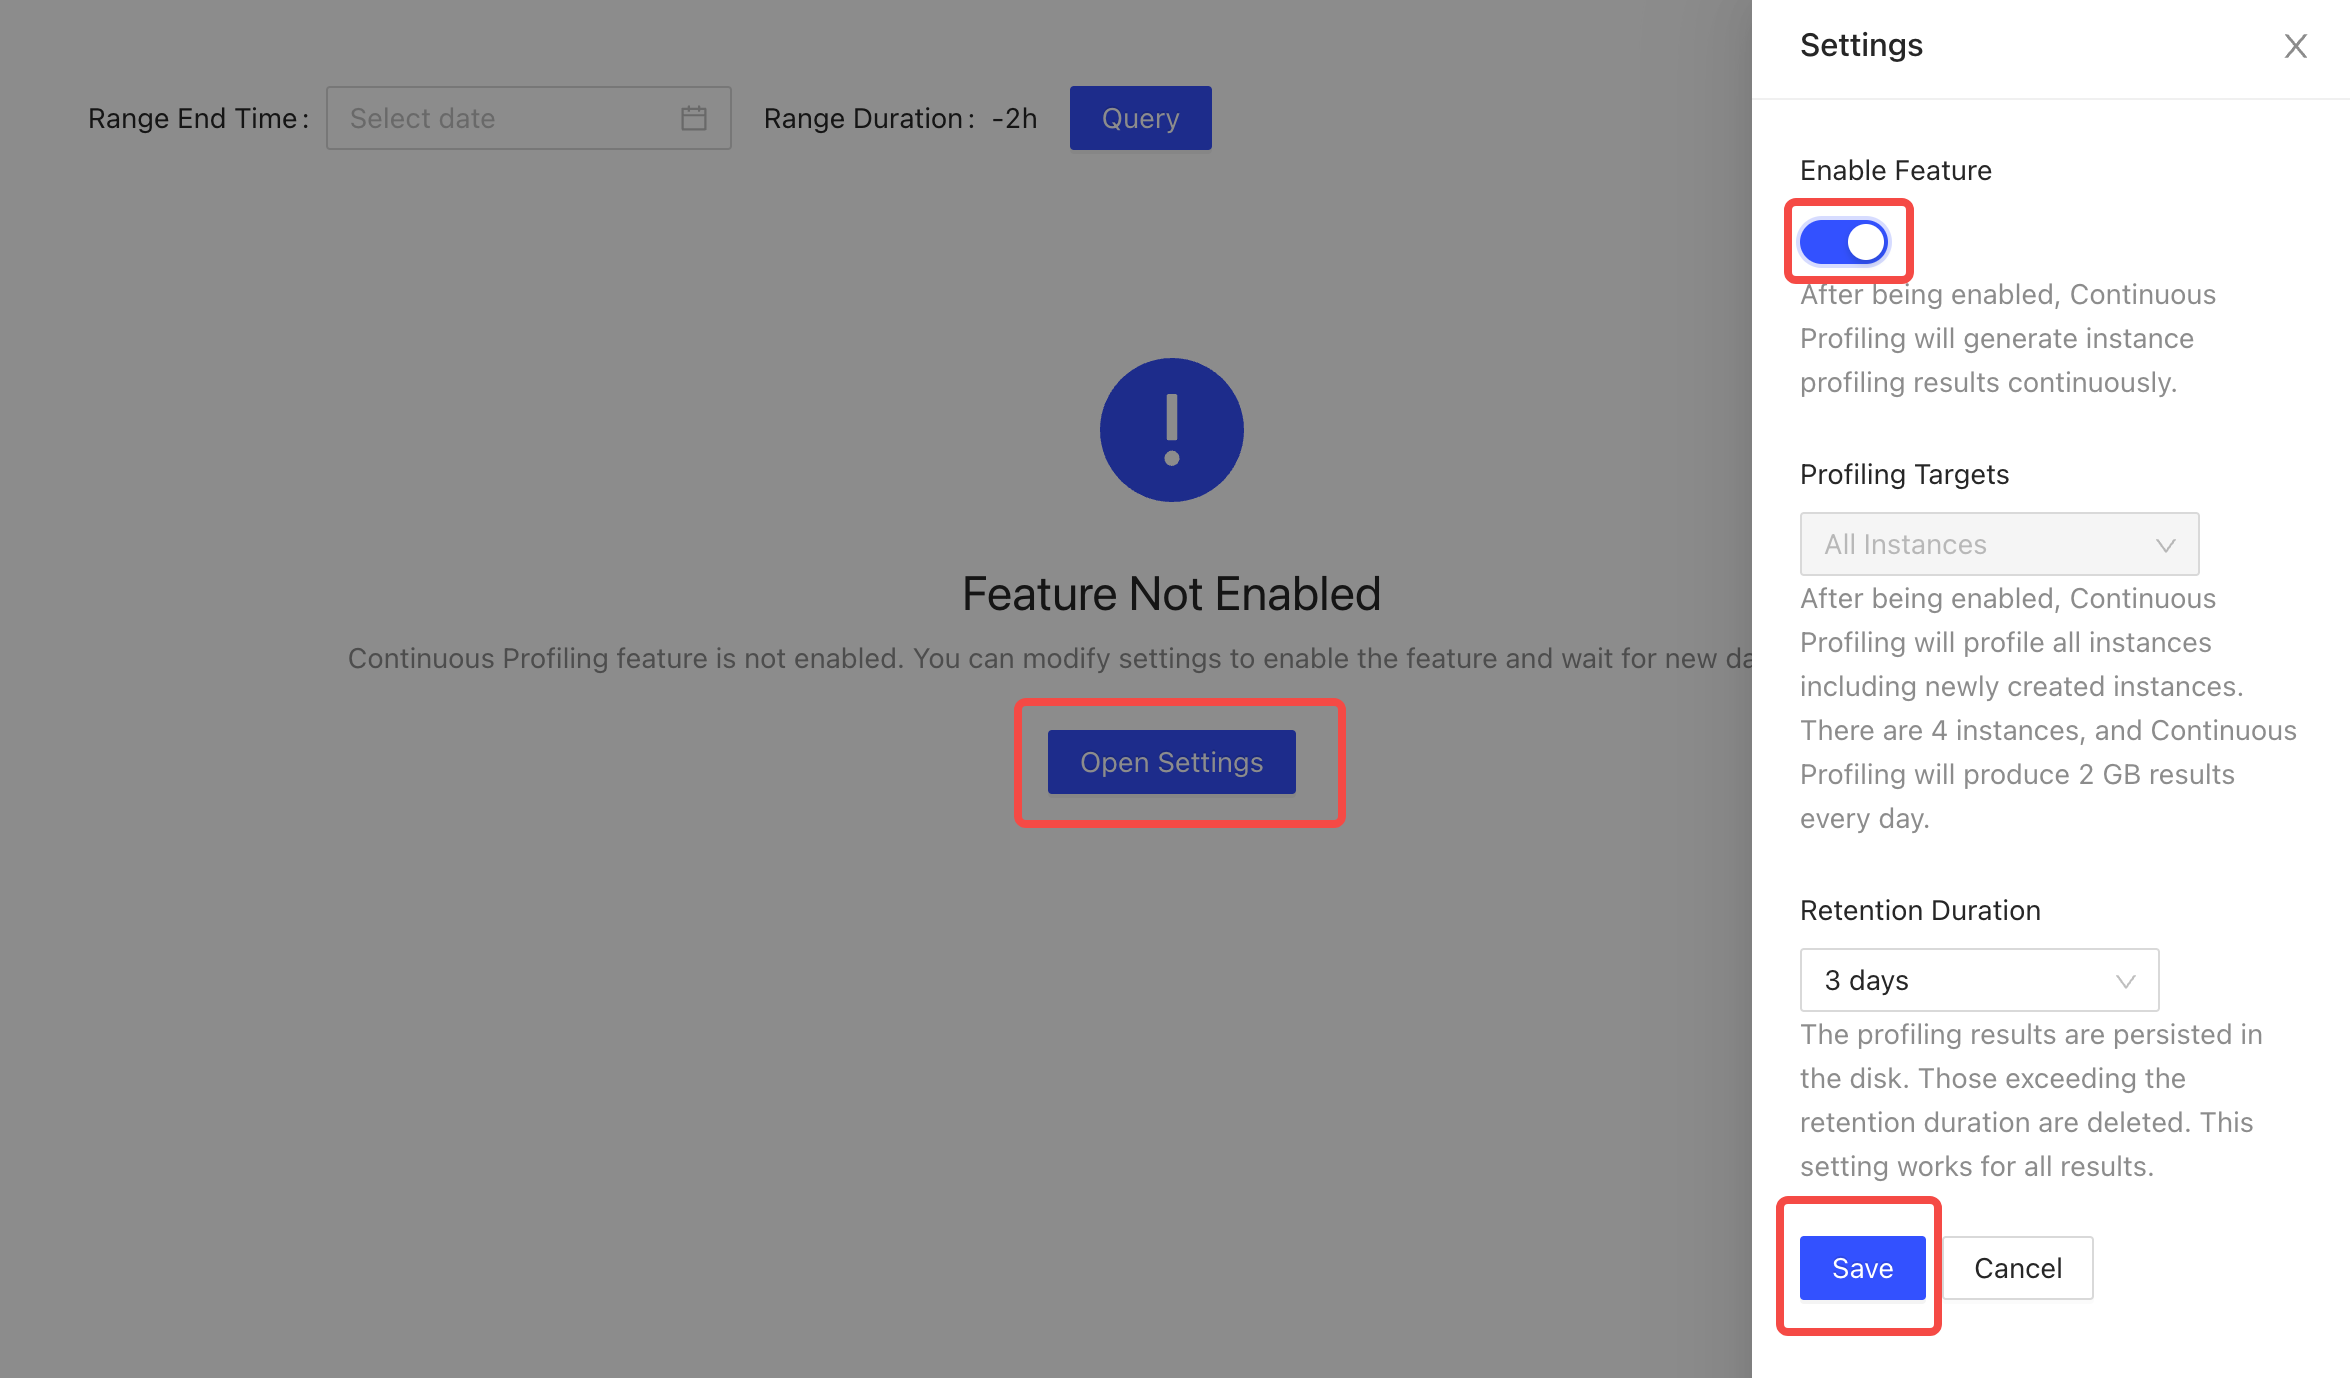
To enable this feature:
- Visit the Continuous Profiling page.
- Click Open Settings. In the Settings area on the right, switch Enable Feature on, and modify the default value of Retention Duration if necessary.
- Click Save.
View current performance data
Manual Profiling cannot be initiated on clusters that have Continuous Profiling enabled. To view the performance data at the current moment, just click on the most recent profiling result.
View historical performance data
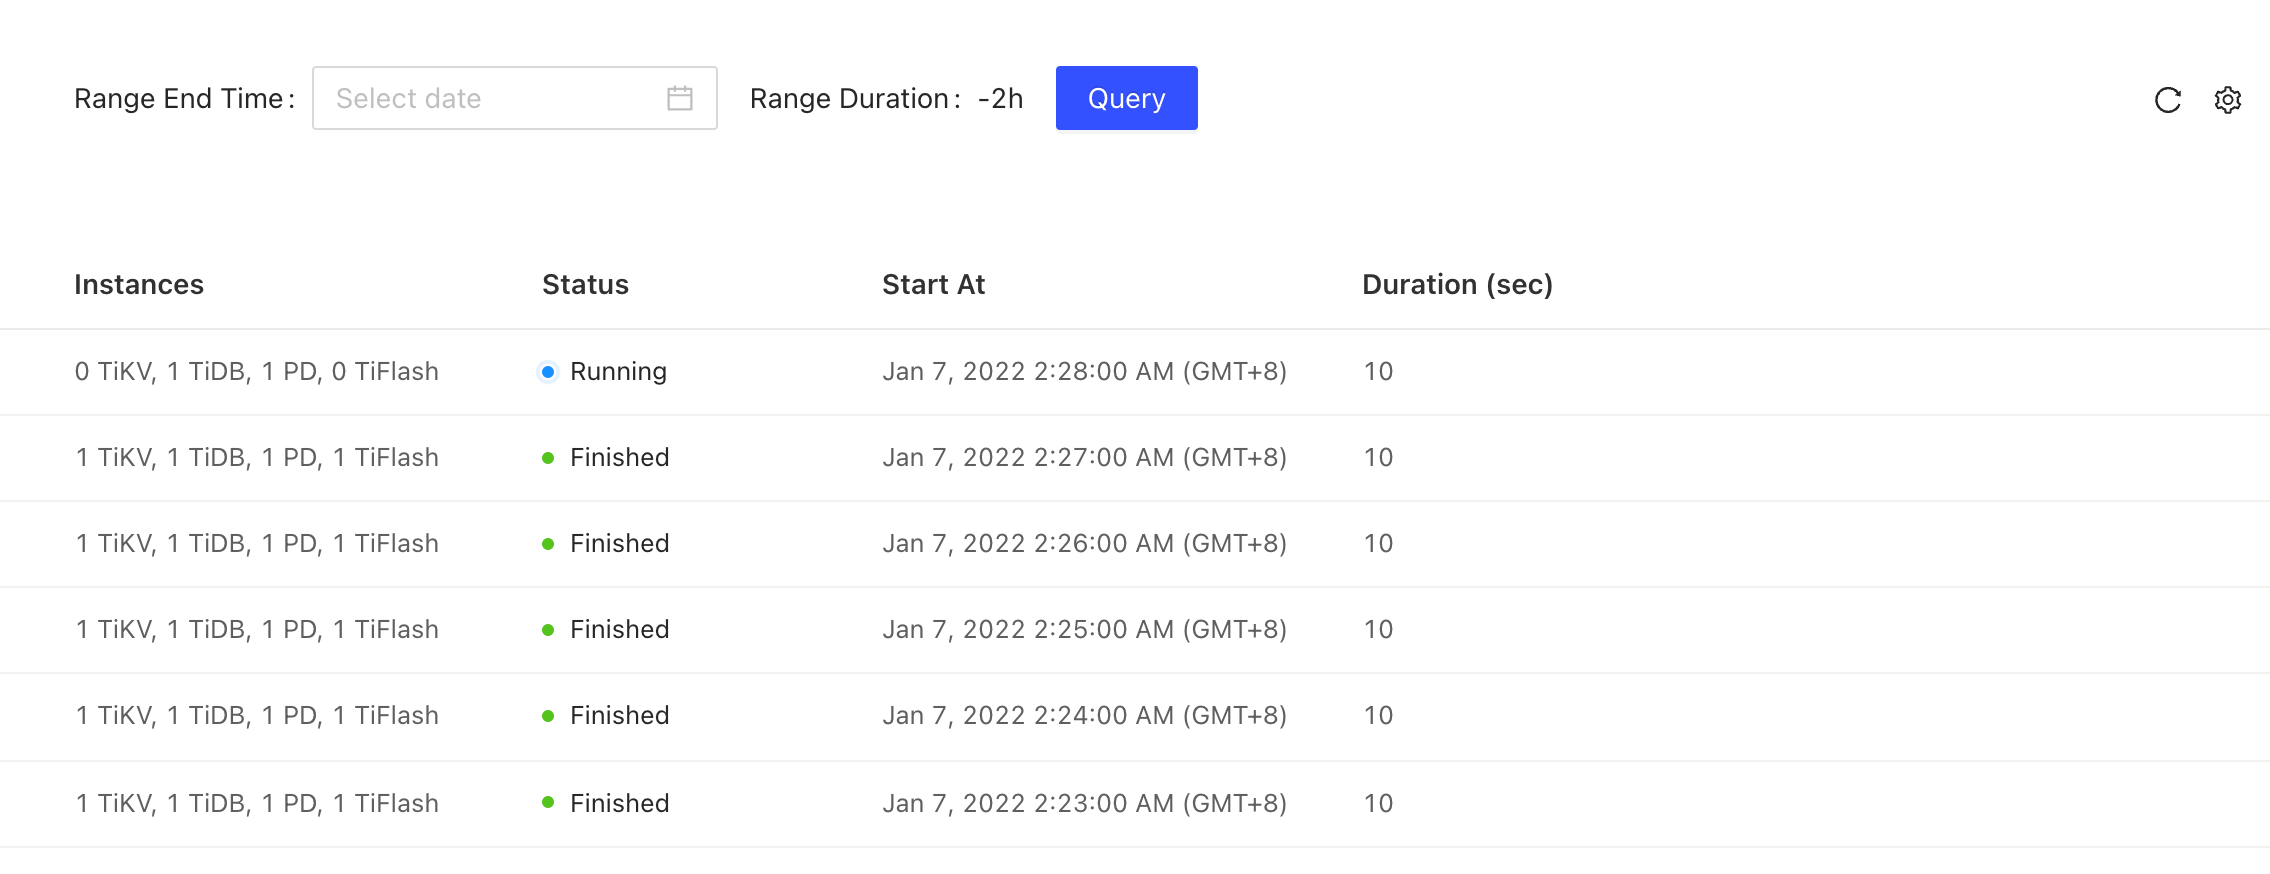
On the list page, you can see all performance data collected since the enabling of this feature.
Download performance data
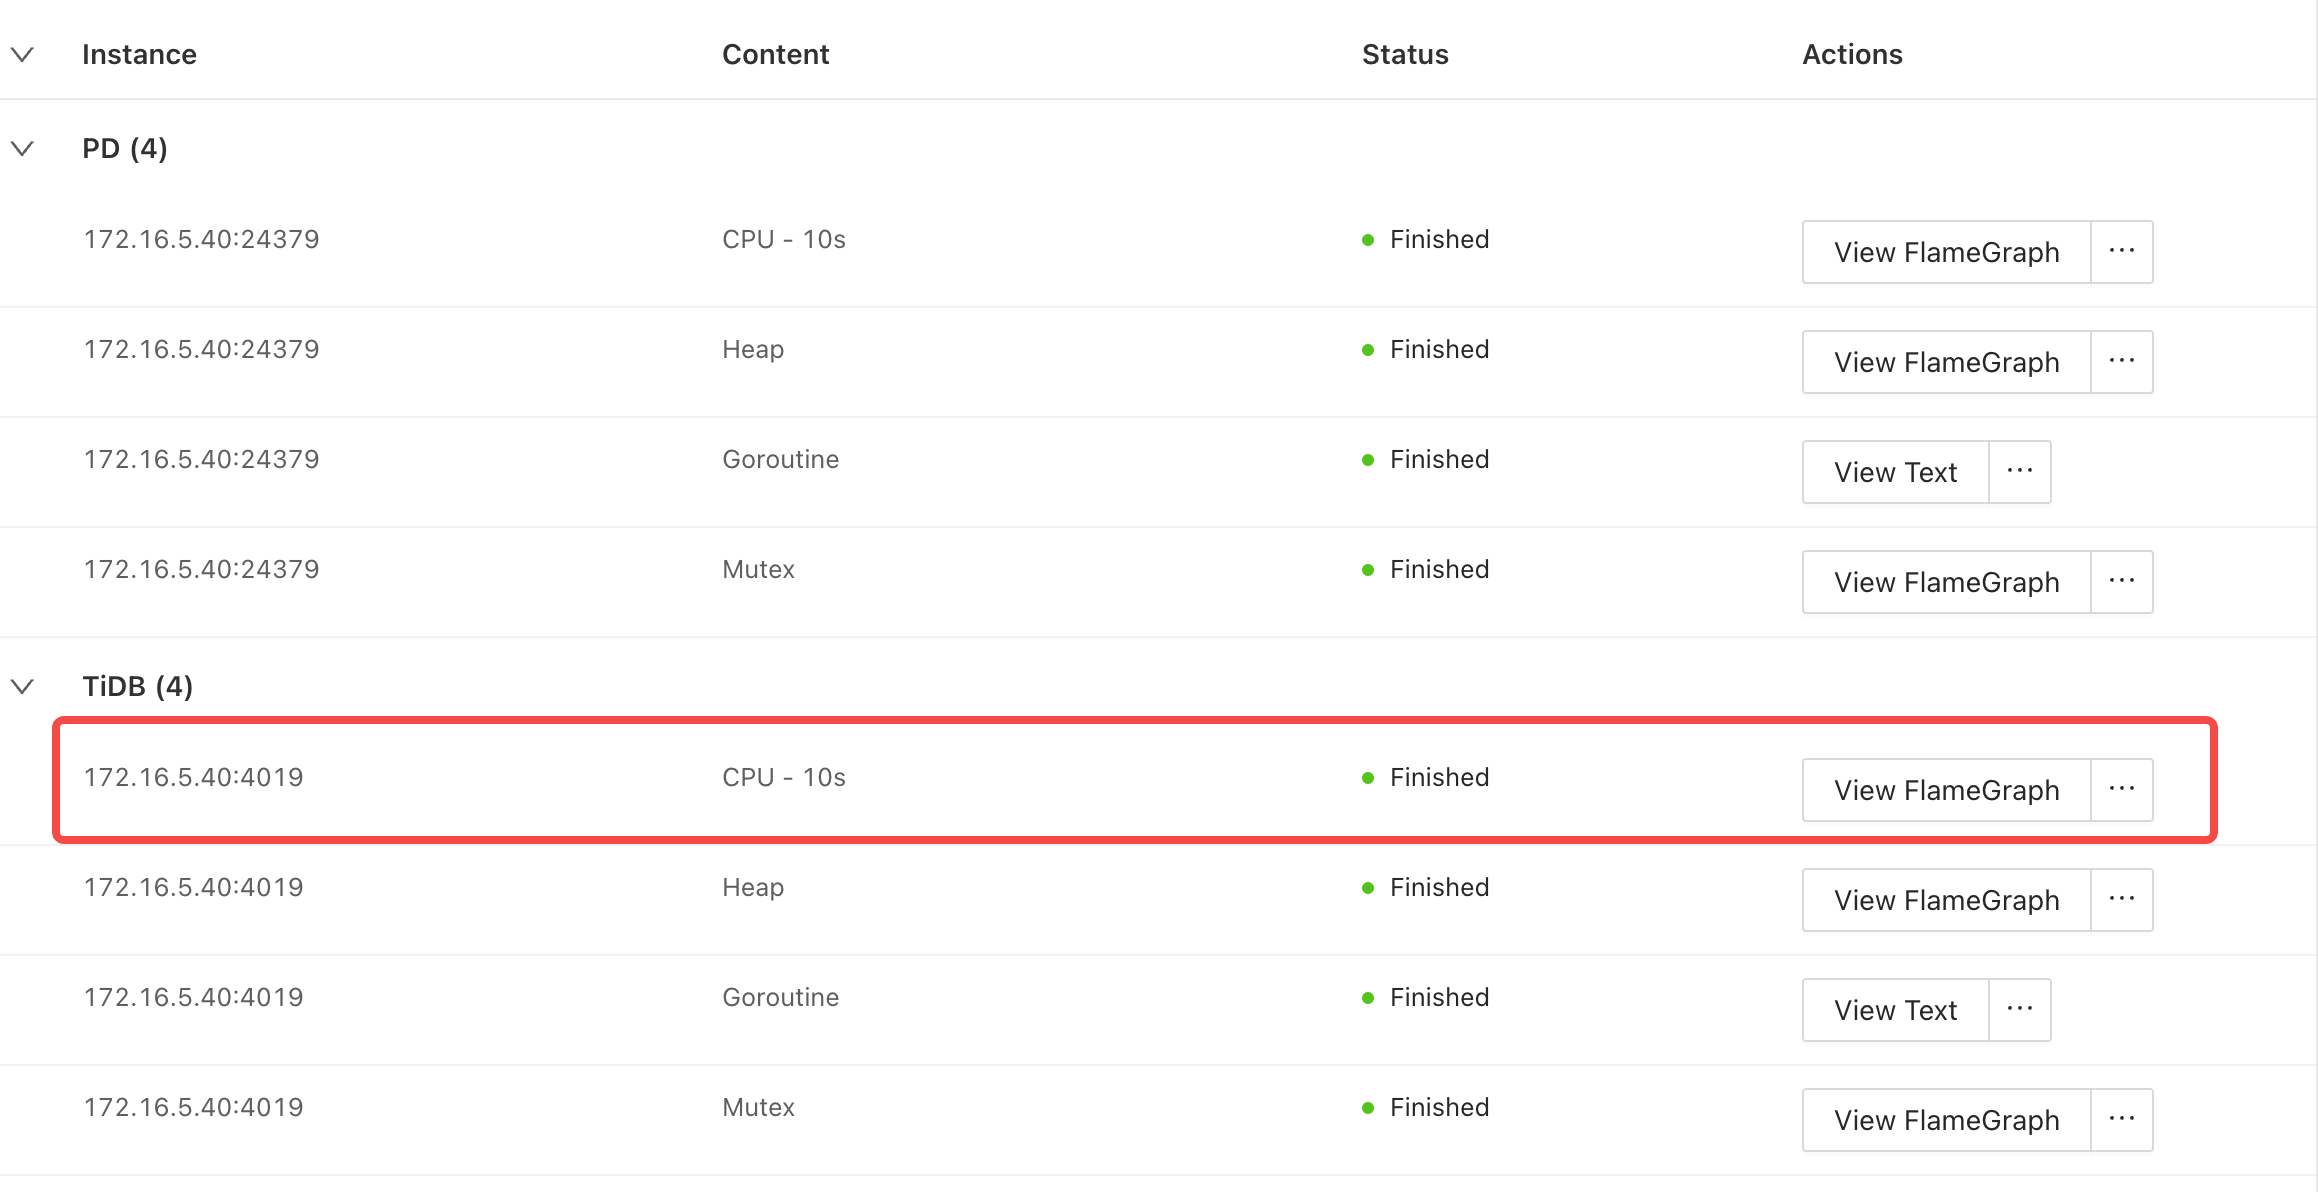
On the profiling result page, you can click Download Profiling Result in the upper-right corner to download all profiling results.
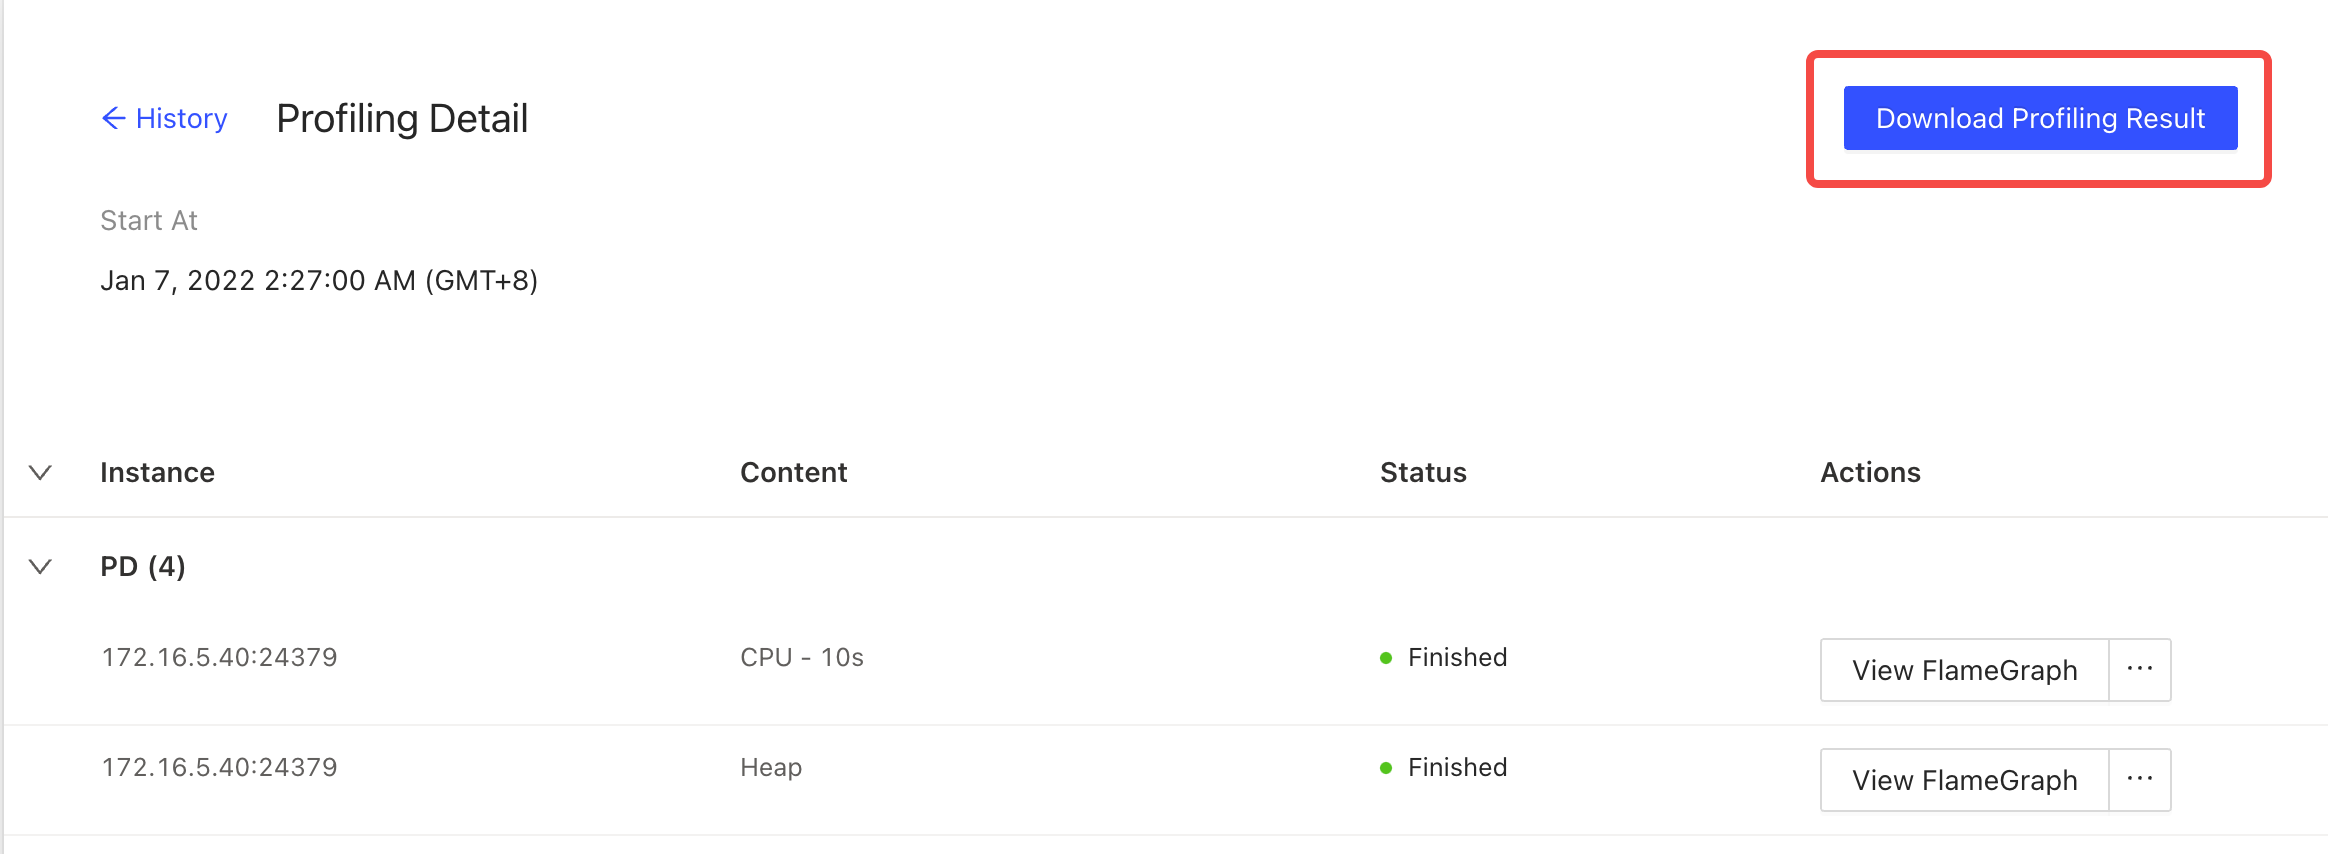
You can also click an individual instance in the table to view its profiling result. Alternatively, you can hover on ... to download raw data.
Disable Continuous Profiling
- Visit the Continuous Profiling page.
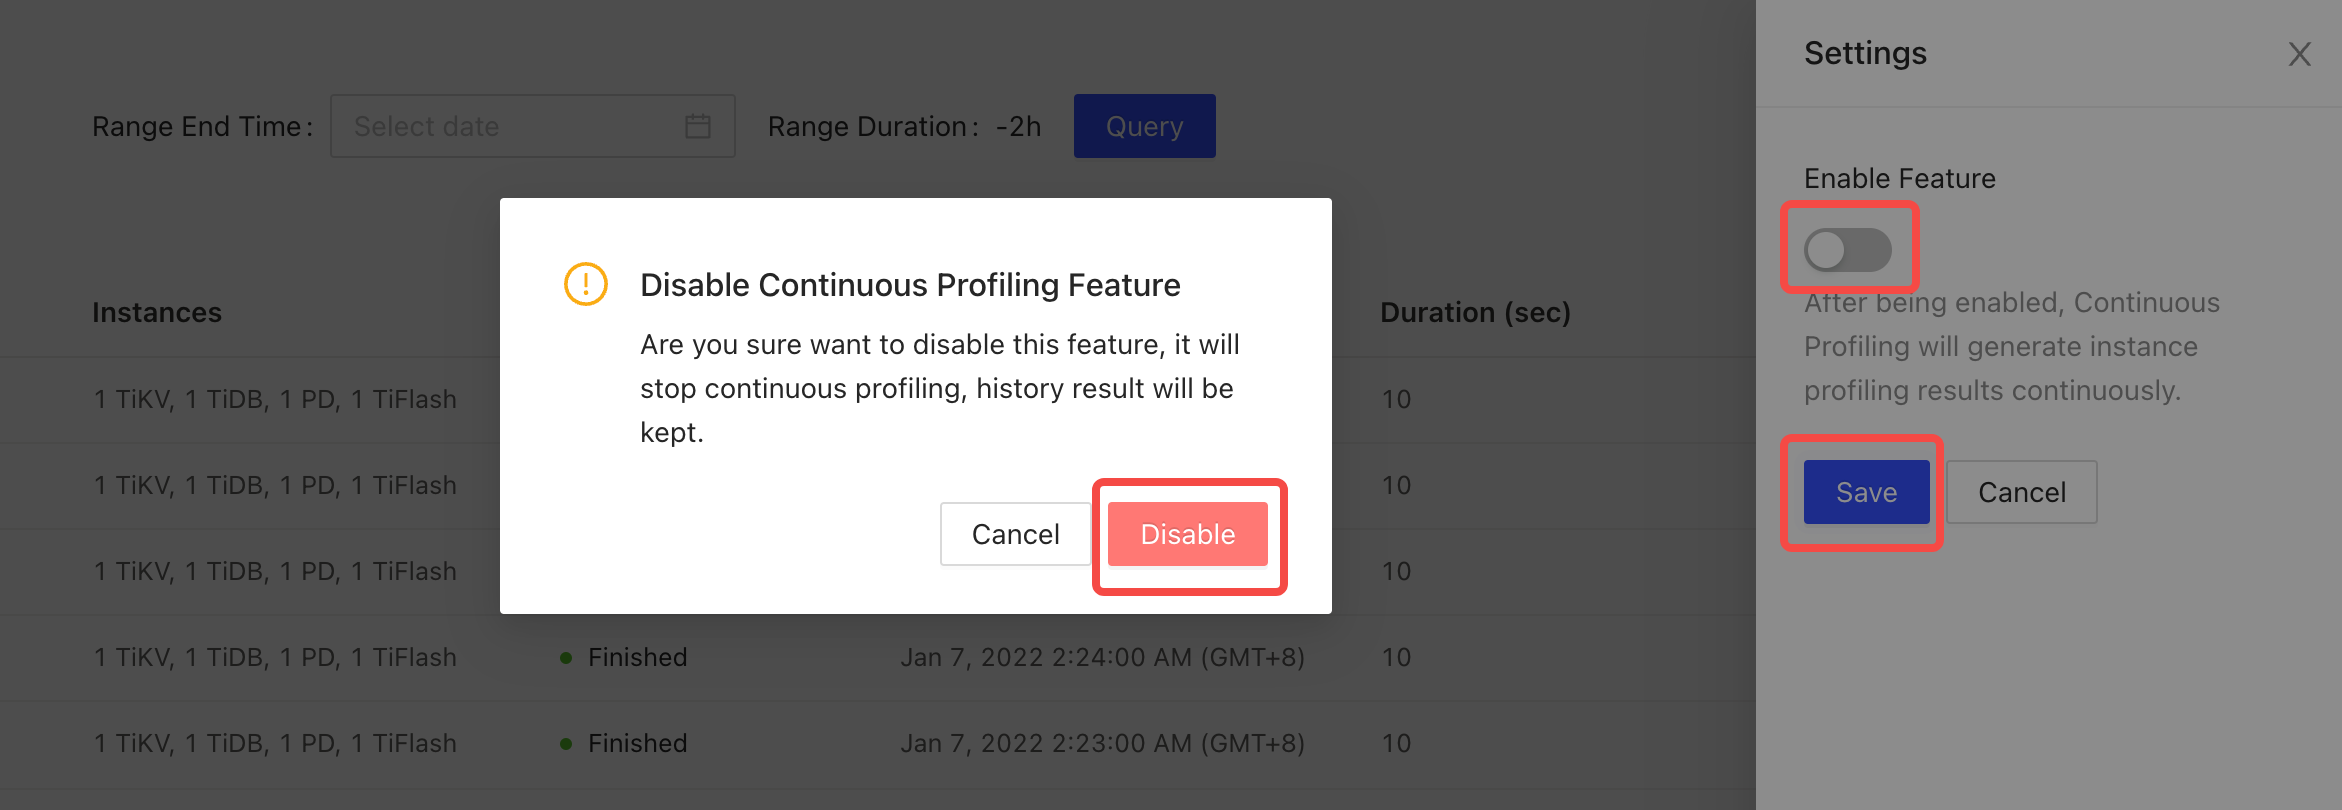
- Click the gear icon in the upper right corner to open the settings page. Switch Enable Feature off.
- Click Save.
- In the popped-up dialog box, click Disable.
Frequently asked questions
1. Continuous Profiling cannot be enabled and the UI displays "required component NgMonitoring is not started".
See TiDB Dashboard FAQ.
2. Will performance be affected after enabling Continuous Profiling?
According to our benchmark, the average performance impact is less than 1% when the feature is enabled.
3. What is the status of this feature?
It is now a generally available (GA) feature and can be used in production environments.