Performance Tuning Practices for OLTP Scenarios
TiDB provides comprehensive performance diagnostics and analysis features, such as Top SQL and Continuous Profiling features on the TiDB Dashboard, and TiDB Performance Overview Dashboard.
This document describes how to use these features together to analyze and compare the performance of the same OLTP workload in seven different runtime scenarios, which demonstrates a performance tuning process to help you analyze and tune TiDB performance efficiently.
By running the same application with different JDBC configurations in these scenarios, this document shows you how the overall system performance is affected by different interactions between applications and databases, so that you can apply Best Practices for Developing Java Applications with TiDB for better performance.
Environment description
This document takes a core banking OLTP workload for demonstration. The configurations of the simulation environment are as follows:
- Application development language for the workload: JAVA
- SQL statements used in business: 200 statements in total, 90% of which are SELECT statements. It is a typical read-heavy OLTP workload.
- Tables used in transactions: 60 tables in total. 12 tables involve update operations, and the rest 48 tables are read-only.
- Isolation level used by the application:
read committed. - TiDB cluster configuration: 3 TiDB nodes and 3 TiKV nodes, with 16 CPUs allocated to each node.
- Client server configuration: 36 CPUs.
Scenario 1. Use the Query interface
Application configuration
The application uses the following JDBC configuration to connect to the database through the Query interface.
useServerPrepStmts=false
Performance analysis
TiDB Dashboard
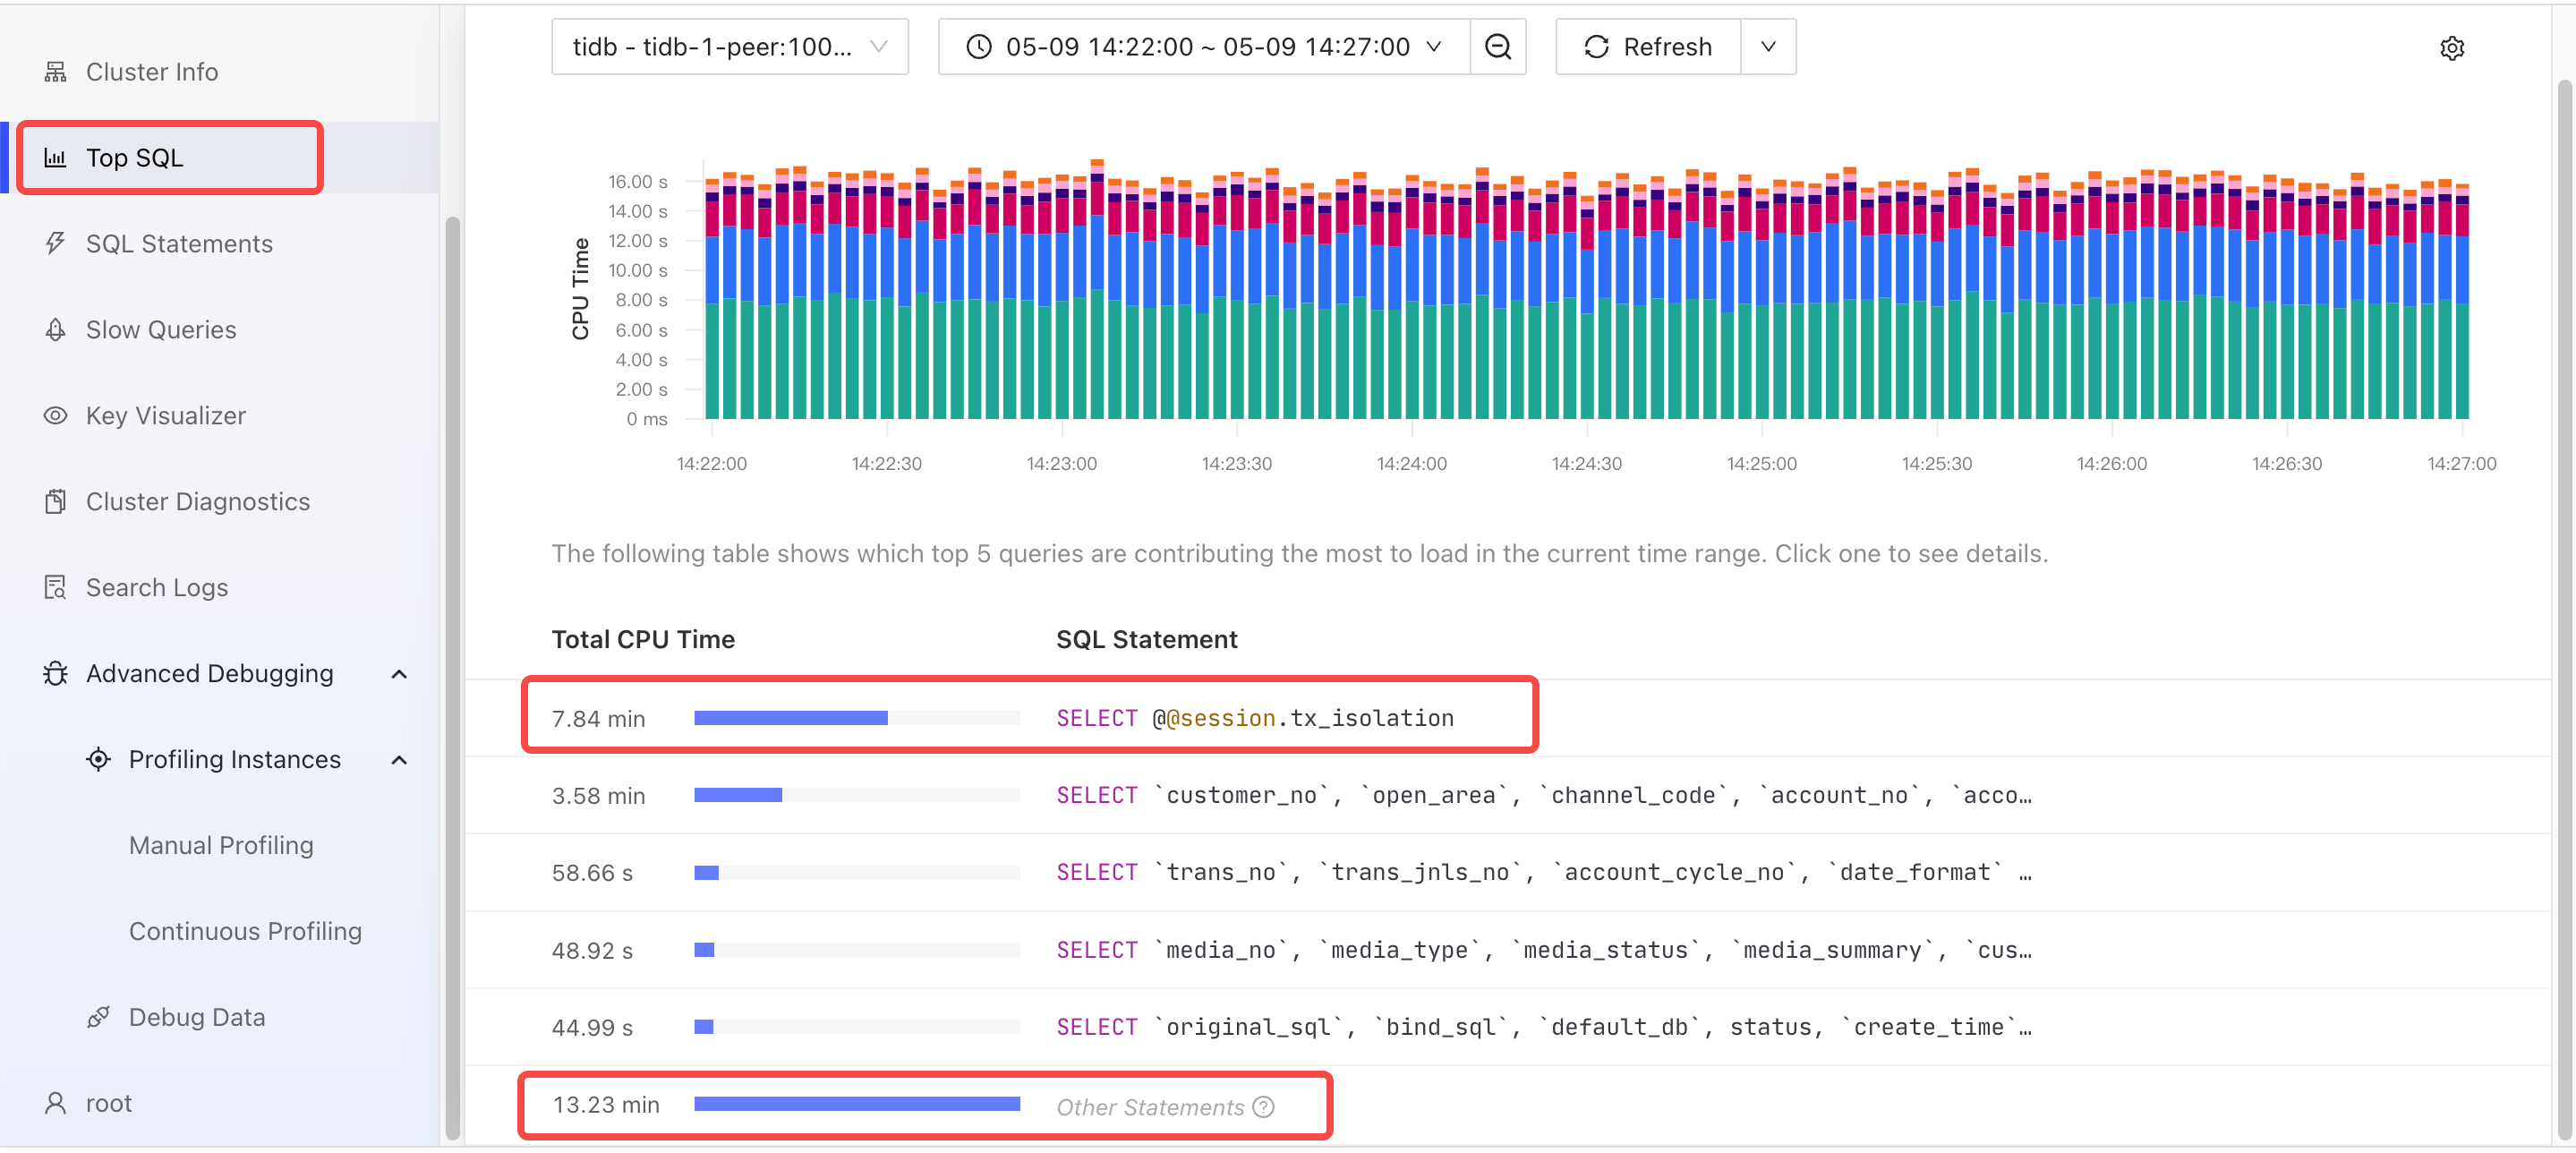
From the Top SQL page in the TiDB Dashboard below, you can see that the non-business SQL type SELECT @@session.tx_isolation consumes the most resources. Although TiDB processes these types of SQL statements quickly, these types of SQL statements have the highest number of executions that result in the highest overall CPU time consumption.
From the following flame chart of TiDB, you can see that the CPU consumption of functions such as Compile and Optimize is significant during the SQL execution. Because the application uses the Query interface, TiDB cannot use the execution plan cache. TiDB needs to compile and generate an execution plan for each SQL statement.
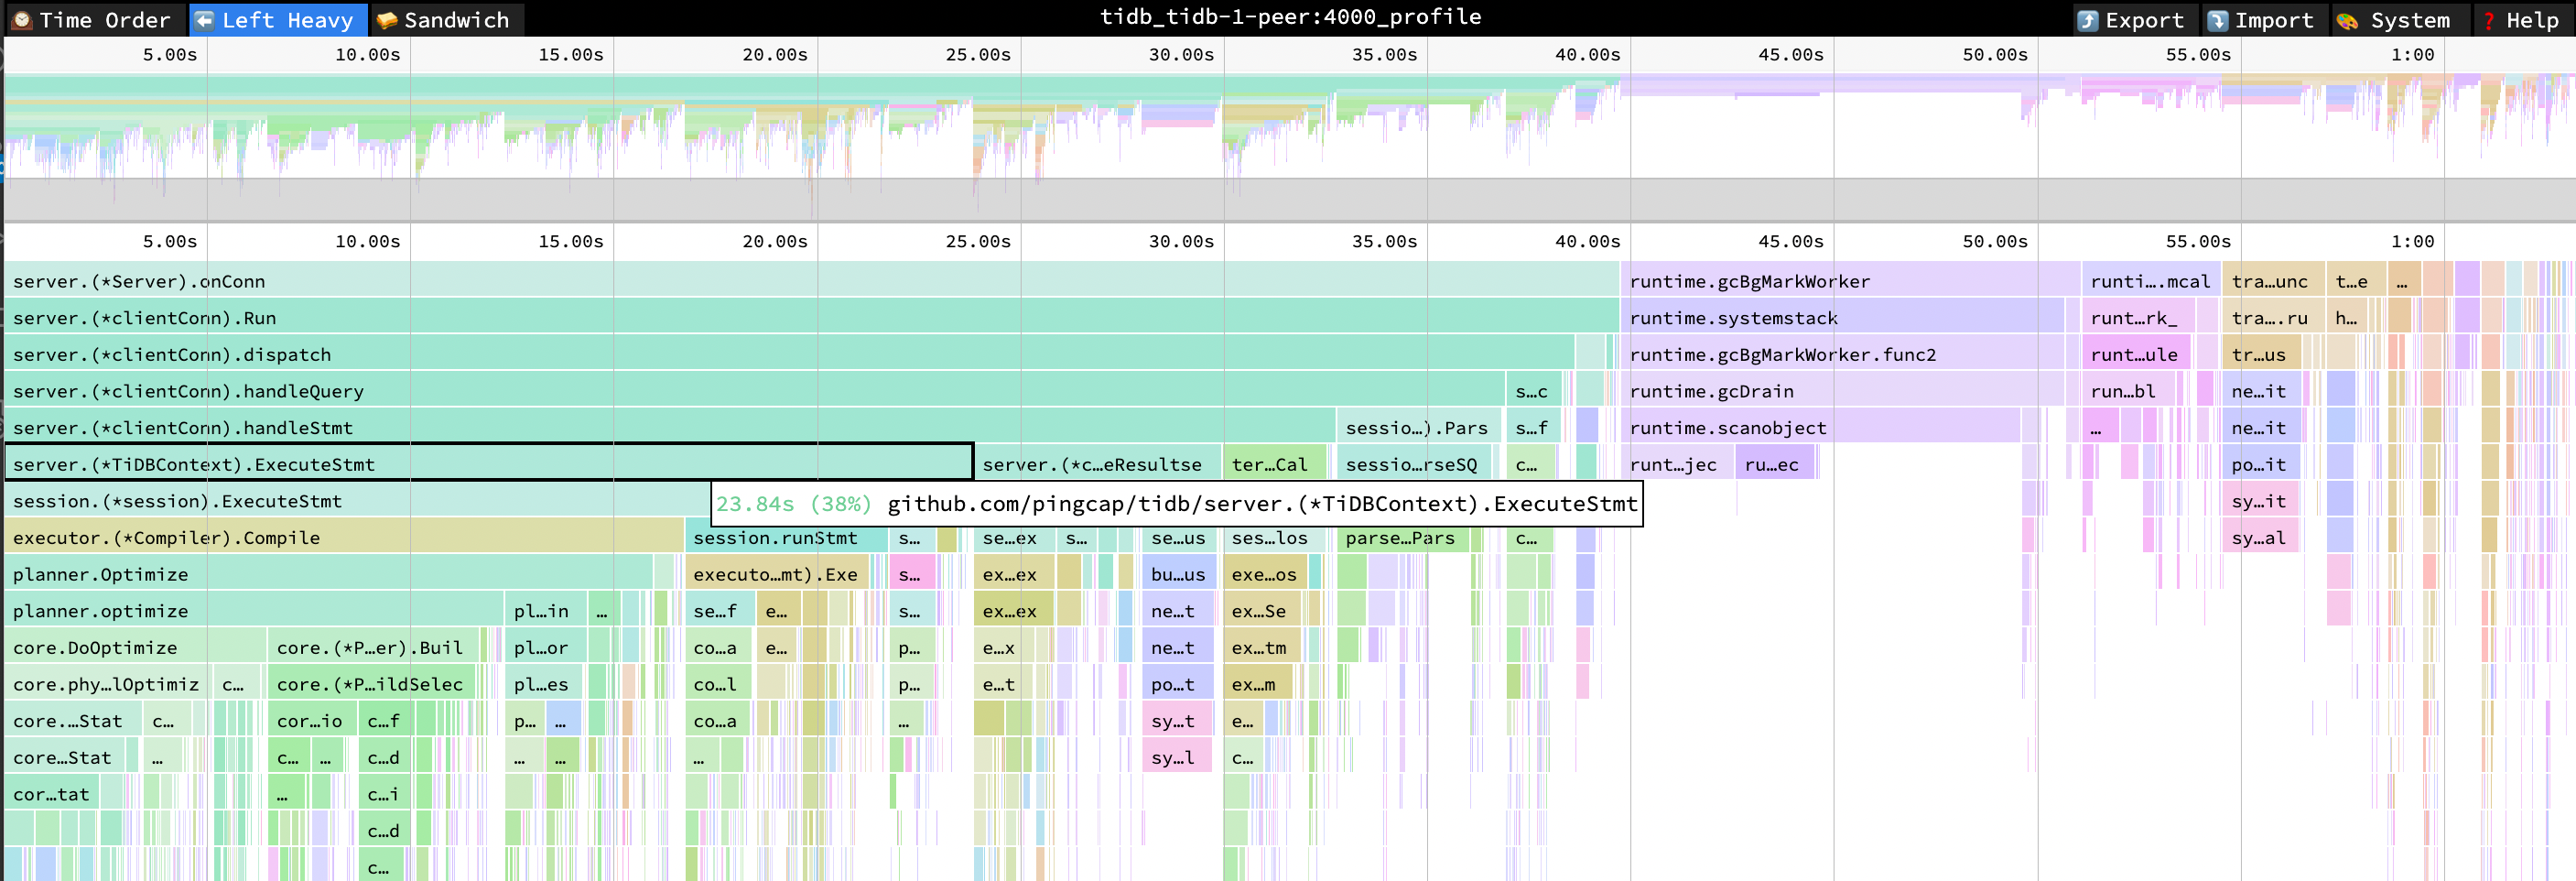
- ExecuteStmt cpu = 38% cpu time = 23.84s
- Compile cpu = 27% cpu time = 17.17s
- Optimize cpu = 26% cpu time = 16.41s
Performance Overview dashboard
Check the database time overview and QPS in the following Performance Overview dashboard.
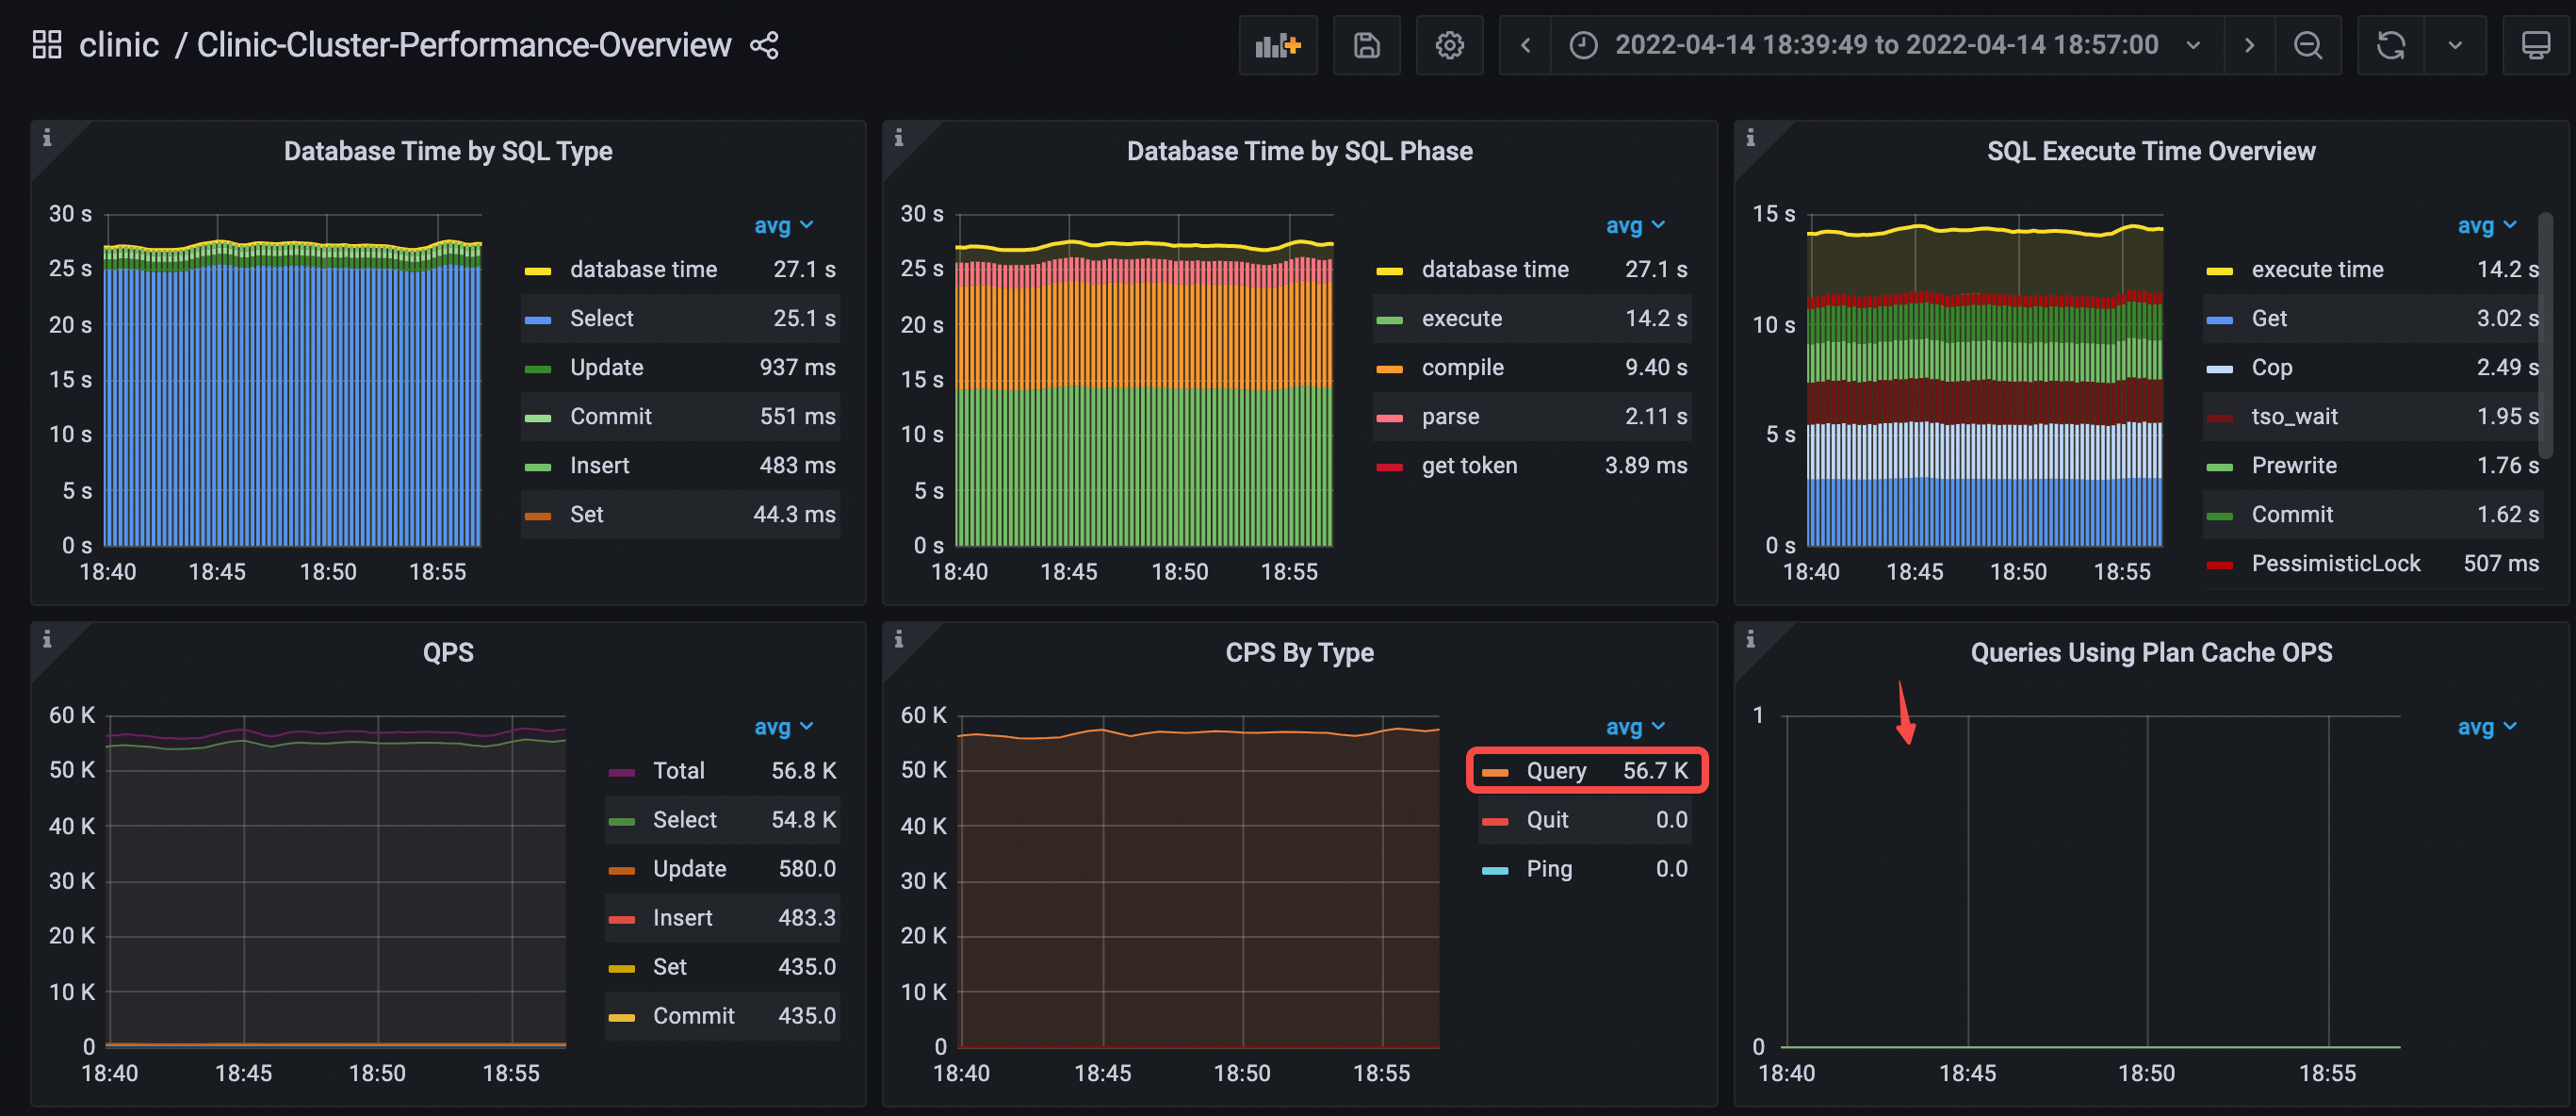
- Database Time by SQL Type: the
Selectstatement type takes most of the time. - Database Time by SQL Phase: the
executeandcompilephases take most of the time. - SQL Execute Time Overview:
Get,Cop, andtso waittake most of the time. - CPS By Type: only the
Querycommand is used. - Queries Using Plan Cache OPS: no data indicates that the execution plan cache is not hit.
- In the query duration, the latency of
executeandcompiletakes the highest percentage. - avg QPS = 56.8k
Check the resource consumption of the cluster: the average utilization of TiDB CPU is 925%, the average utilization of TiKV CPU is 201%, and the average throughput of TiKV IO is 18.7 MB/s. The resource consumption of TiDB is significantly higher.

Analysis conclusion
We need to eliminate these useless non-business SQL statements, which have a large number of executions and contribute to the high TiDB CPU usage.
Scenario 2. Use the maxPerformance configuration
Application configuration
The application adds a new parameter useConfigs=maxPerformance to the JDBC connection string in Scenario 1. This parameter can be used to eliminate the SQL statements sent from JDBC to the database (for example, select @@session.transaction_read_only). The full configuration is as follows:
useServerPrepStmts=false&useConfigs=maxPerformance
Performance analysis
TiDB Dashboard
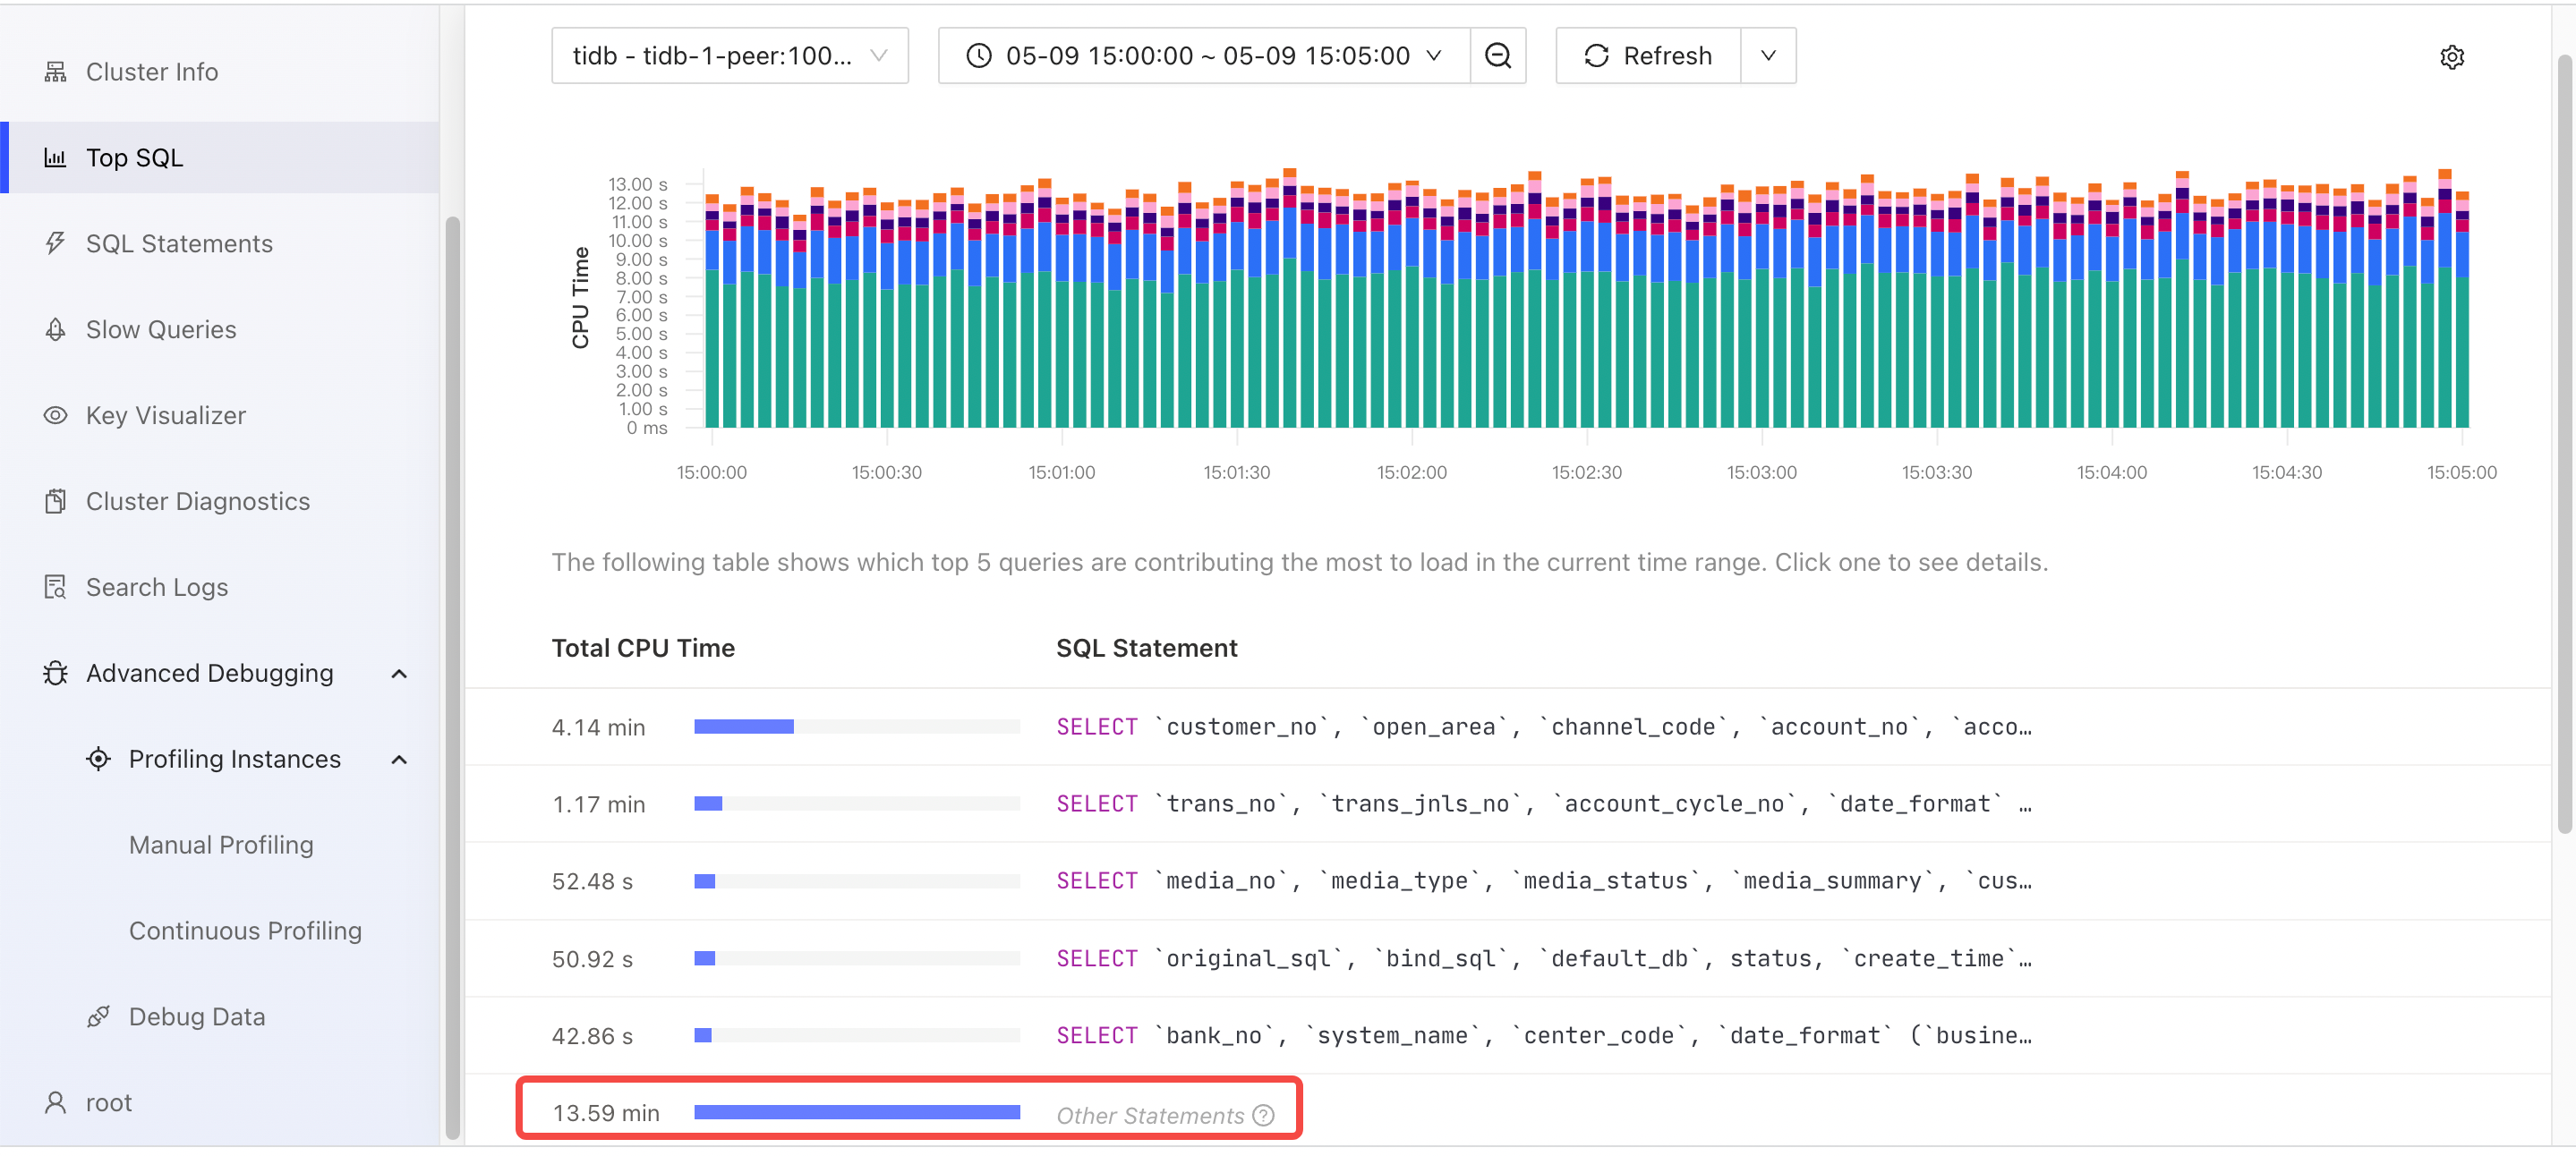
From the Top SQL page in the TiDB Dashboard below, you can see that SELECT @@session.tx_isolation, which consumed the most resources, has disappeared.
From the following flame chart of TiDB, you can see that the CPU consumption of functions such as Compile and Optimize is still significant during the SQL execution.
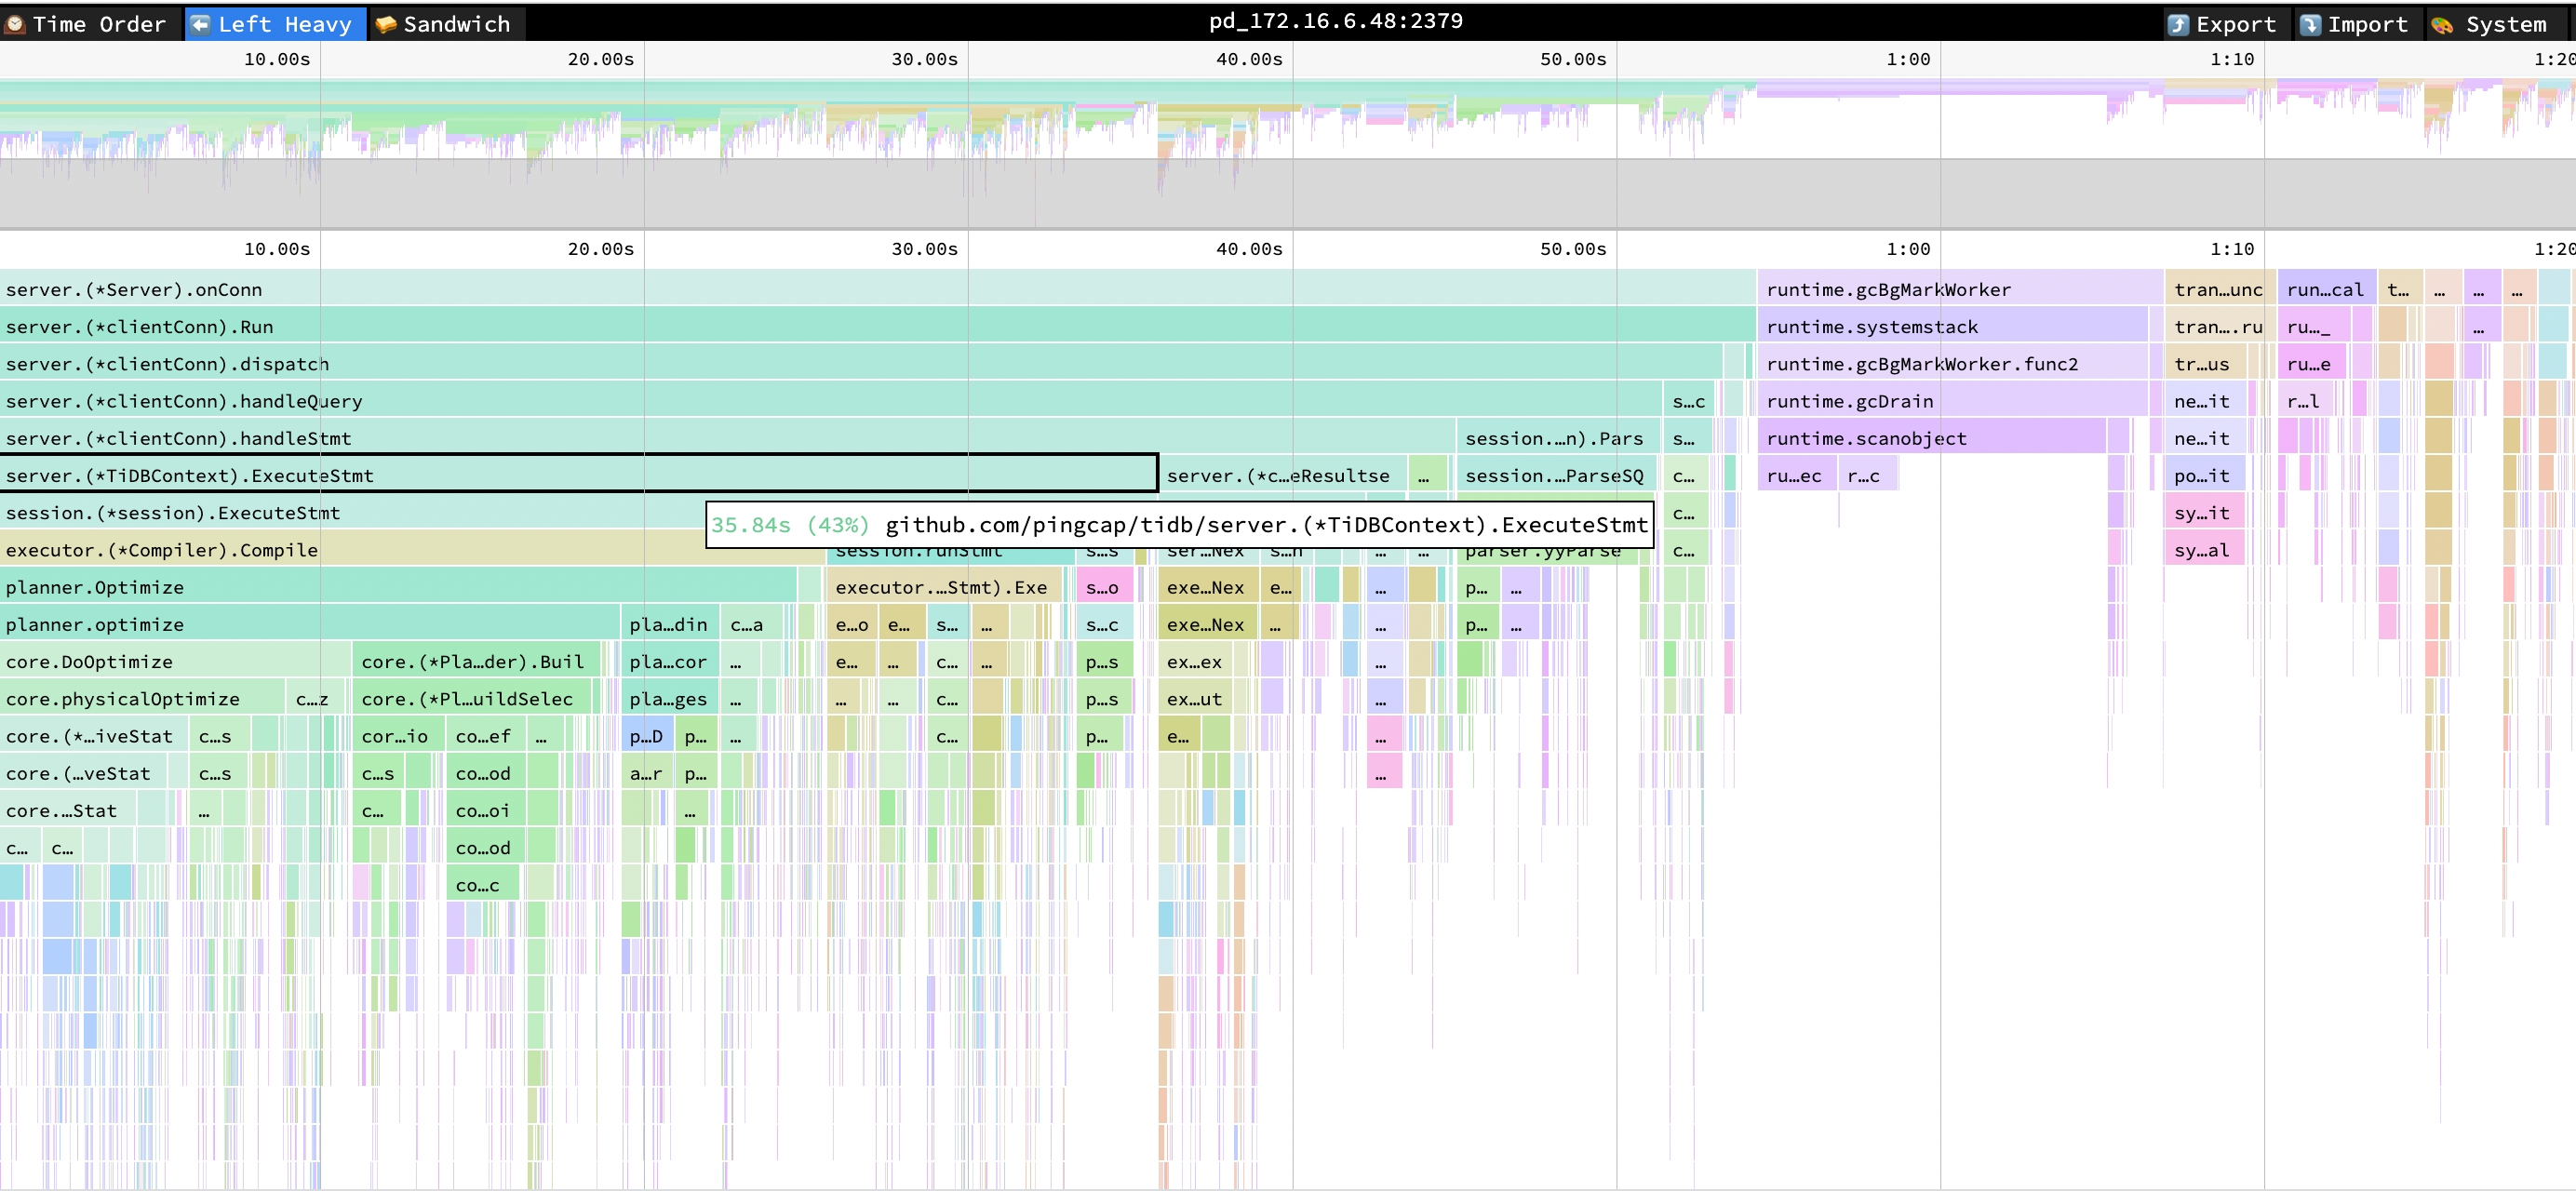
- ExecuteStmt cpu = 43% cpu time =35.84s
- Compile cpu = 31% cpu time =25.61s
- Optimize cpu = 30% cpu time = 24.74s
Performance Overview dashboard
The data of the database time overview and QPS is as follows:
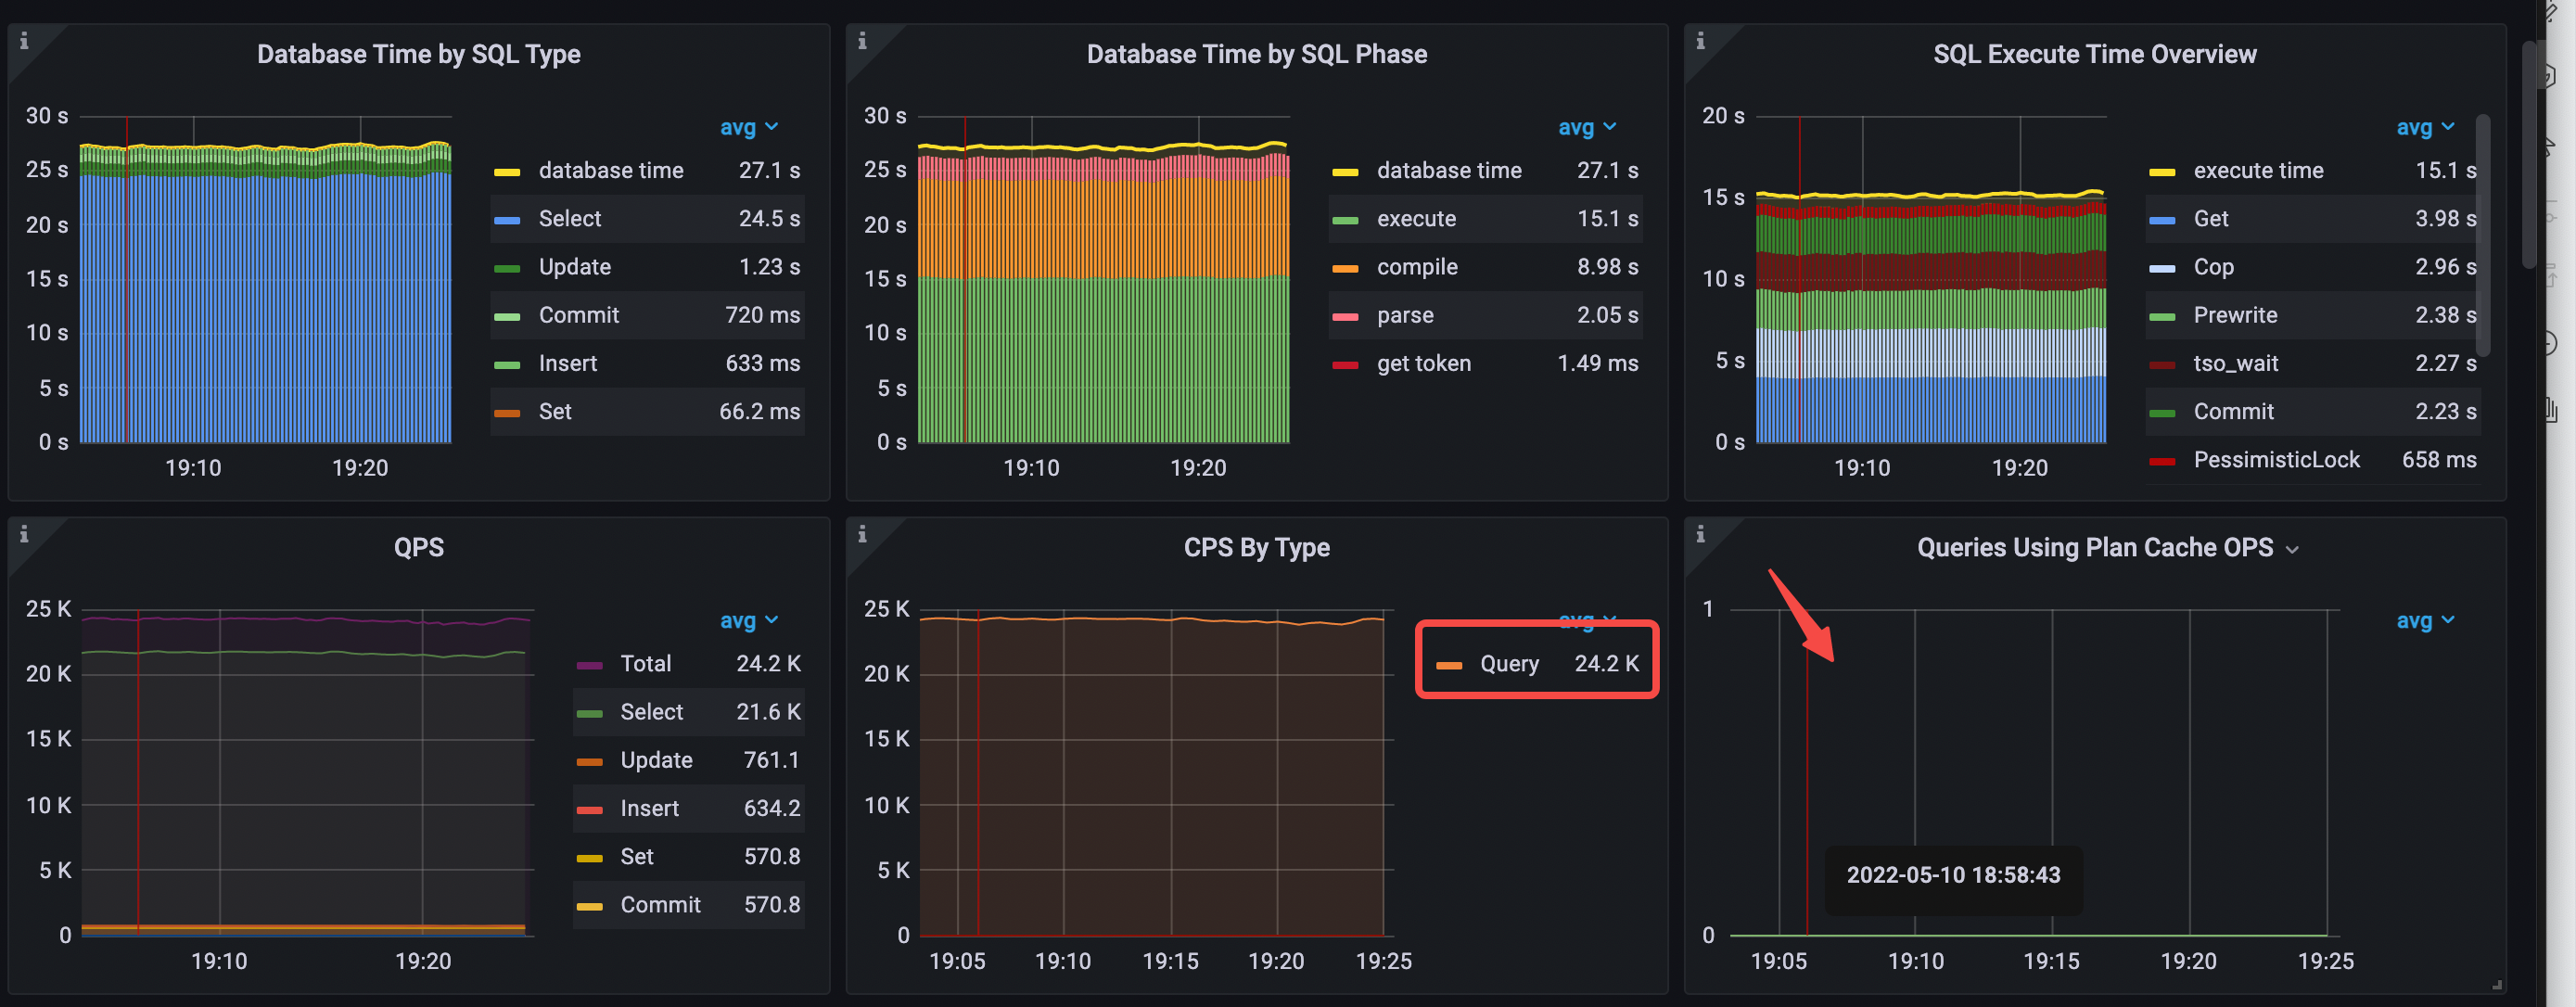
- Database Time by SQL Type: the
Selectstatement type takes most of the time. - Database Time by SQL Phase: the
executeandcompilephases take most of the time. - SQL Execute Time Overview:
Get,Cop,Prewrite, andtso waittake most of the time. - In the database time, the latency of
executeandcompiletakes the highest percentage. - CPS By Type: only the
Querycommand is used. - avg QPS = 24.2k (from 56.3k to 24.2k)
- The execution plan cache is not hit.
From Scenario 1 to Scenario 2, the average TiDB CPU utilization drops from 925% to 874%, and the average TiKV CPU utilization increases from 201% to about 250%.

The changes in key latency metrics are as follows:
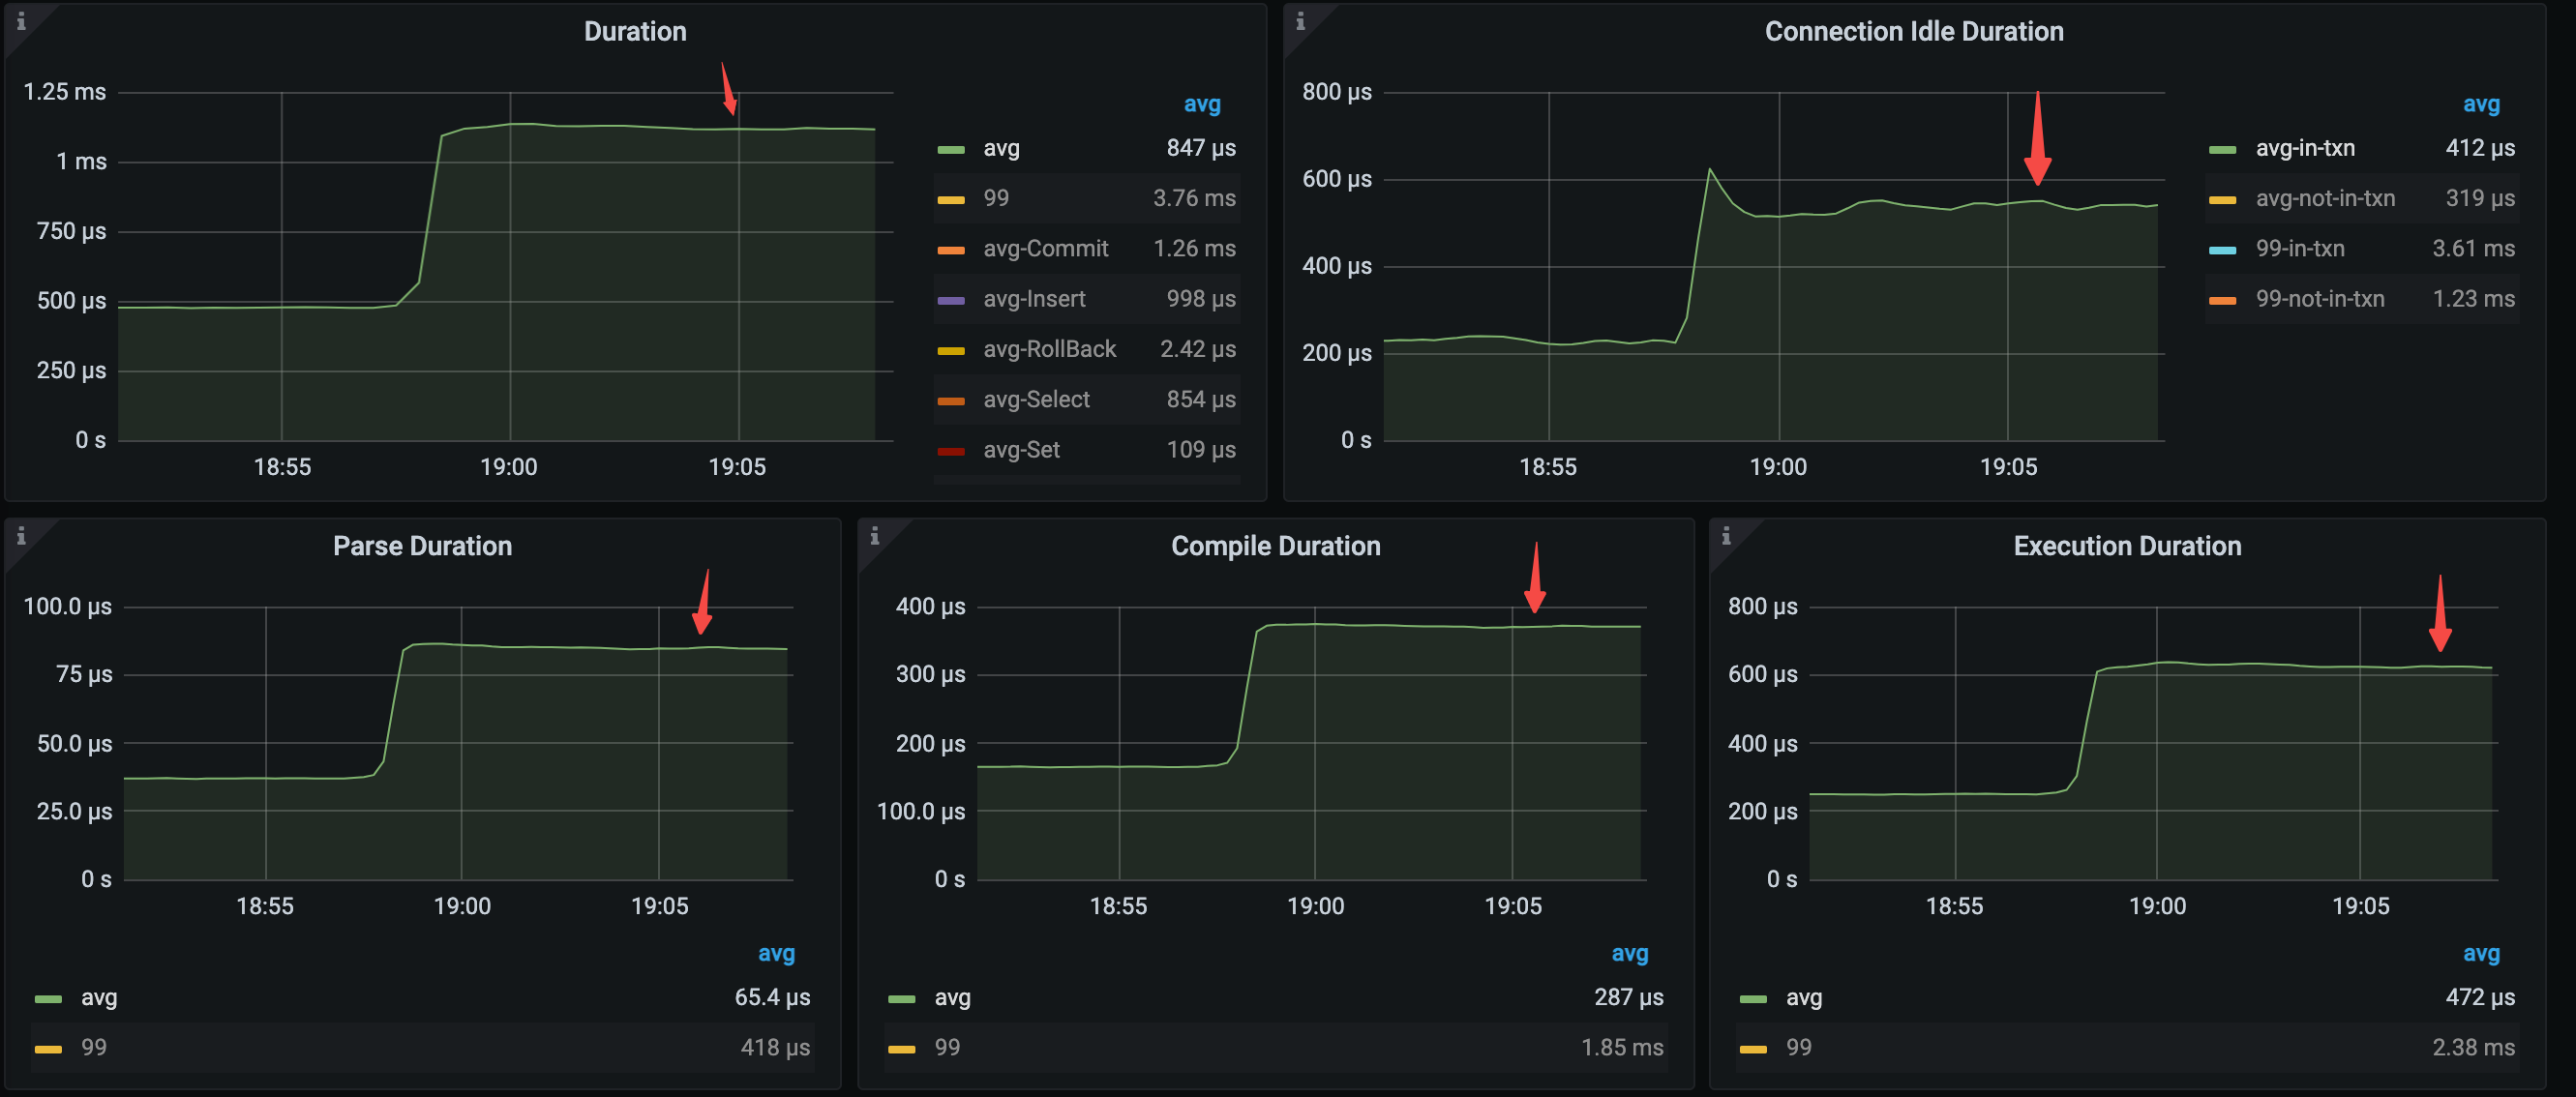
- avg query duration = 1.12ms (from 479μs to 1.12ms)
- avg parse duration = 84.7μs (from 37.2μs to 84.7μs)
- avg compile duration = 370μs (from 166μs to 370μs)
- avg execution duration = 626μs (from 251μs to 626μs)
Analysis conclusion
Compared with Scenario 1, the QPS of Scenario 2 has significantly decreased. The average query duration and average parse, compile, and execute durations have significantly increased. This is because SQL statements such as select @@session.transaction_read_only in Scenario 1, which are executed many times and have fast processing time, lower the average performance data. After Scenario 2 blocks such statements, only business-related SQL statements remain, so the average duration increases.
When the application uses the Query interface, TiDB cannot use the execution plan cache, which results in TiDB consuming high resources to compile execution plans. In this case, it is recommended that you use the Prepared Statement interface, which uses the execution plan cache of TiDB to reduce the TiDB CPU consumption caused by execution plan compiling and decrease the latency.
Scenario 3. Use the Prepared Statement interface with execution plan caching not enabled
Application configuration
The application uses the following connection configuration. Compared with Scenario 2, the value of the JDBC parameter useServerPrepStmts is modified to true, indicating that the Prepared Statement interface is enabled.
useServerPrepStmts=true&useConfigs=maxPerformance"
Performance analysis
TiDB Dashboard
From the following flame chart of TiDB, you can see that the CPU consumption of CompileExecutePreparedStmt and Optimize is still significant after the Prepared Statement interface is enabled.
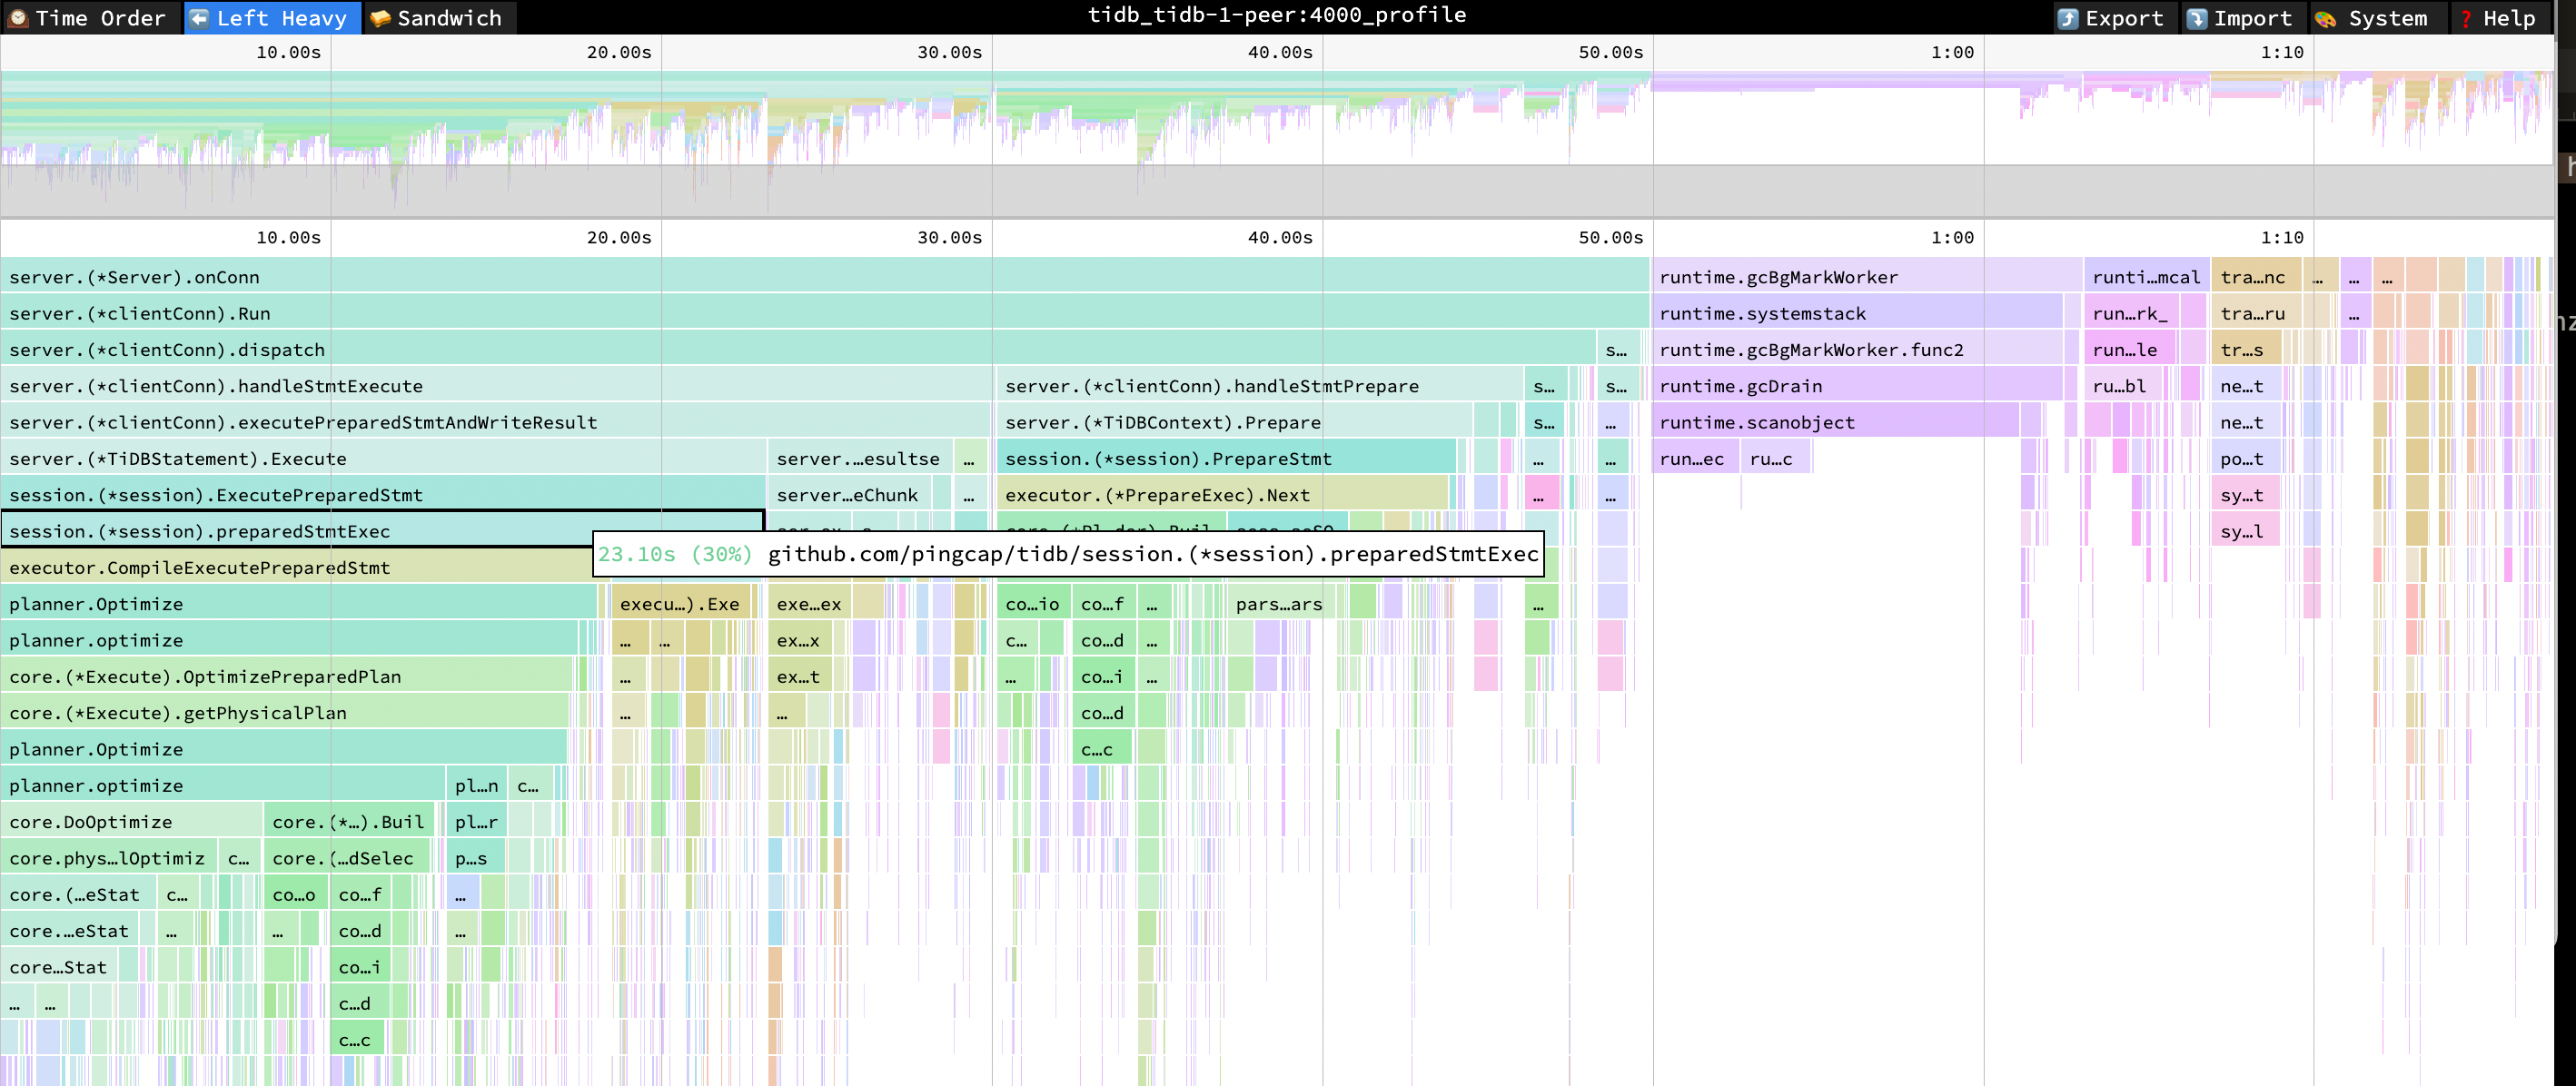
- ExecutePreparedStmt cpu = 31% cpu time = 23.10s
- preparedStmtExec cpu = 30% cpu time = 22.92s
- CompileExecutePreparedStmt cpu = 24% cpu time = 17.83s
- Optimize cpu = 23% cpu time = 17.29s
Performance Overview dashboard
After the Prepared Statement interface is used, the data of database time overview and QPS is as follows:
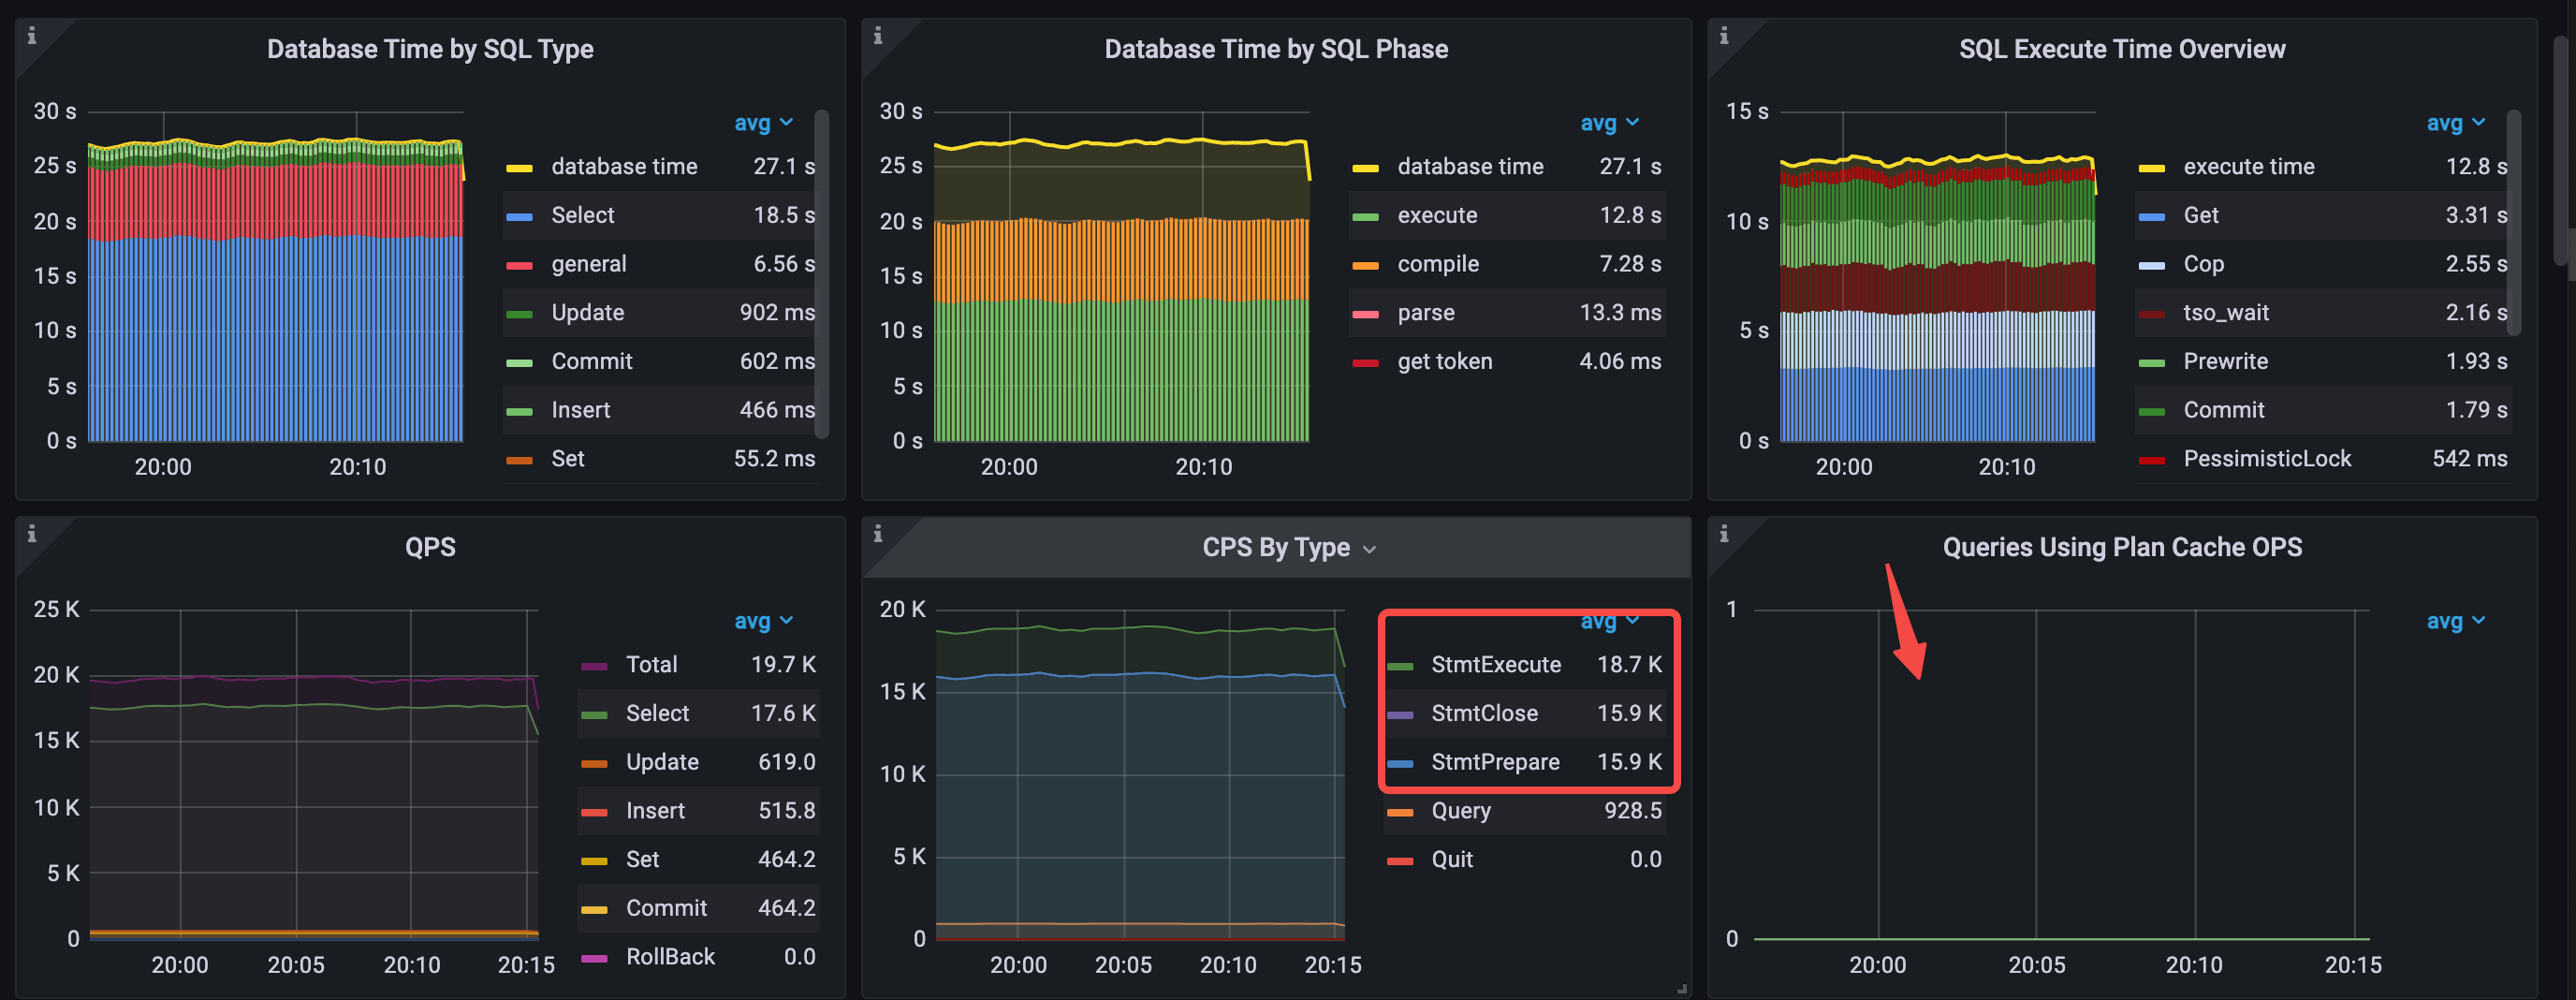
The QPS drops from 24.4k to 19.7k. From the Database Time Overview, you can see that the application uses three types of Prepared commands, and the general statement type (which includes the execution time of commands such as StmtPrepare and StmtClose) takes the second place in Database Time by SQL Type. This indicates that even when the Prepared Statement interface is used, the execution plan cache is not hit. The reason is that, when the StmtClose command is executed, TiDB clears the execution plan cache of SQL statements in the internal processing.
- Database Time by SQL Type: the
Selectstatement type takes most of the time, followed bygeneralstatements. - Database Time by SQL Phase: the
executeandcompilephases take most of the time. - SQL Execute Time Overview:
Get,Cop,Prewrite, andtso waittake most of the time. - CPS By Type: 3 types of commands (
StmtPrepare,StmtExecute,StmtClose) are used. - avg QPS = 19.7k (from 24.4k to 19.7k)
- The execution plan cache is not hit.
The TiDB average CPU utilization increases from 874% to 936%.

The key latency metrics are as follows:
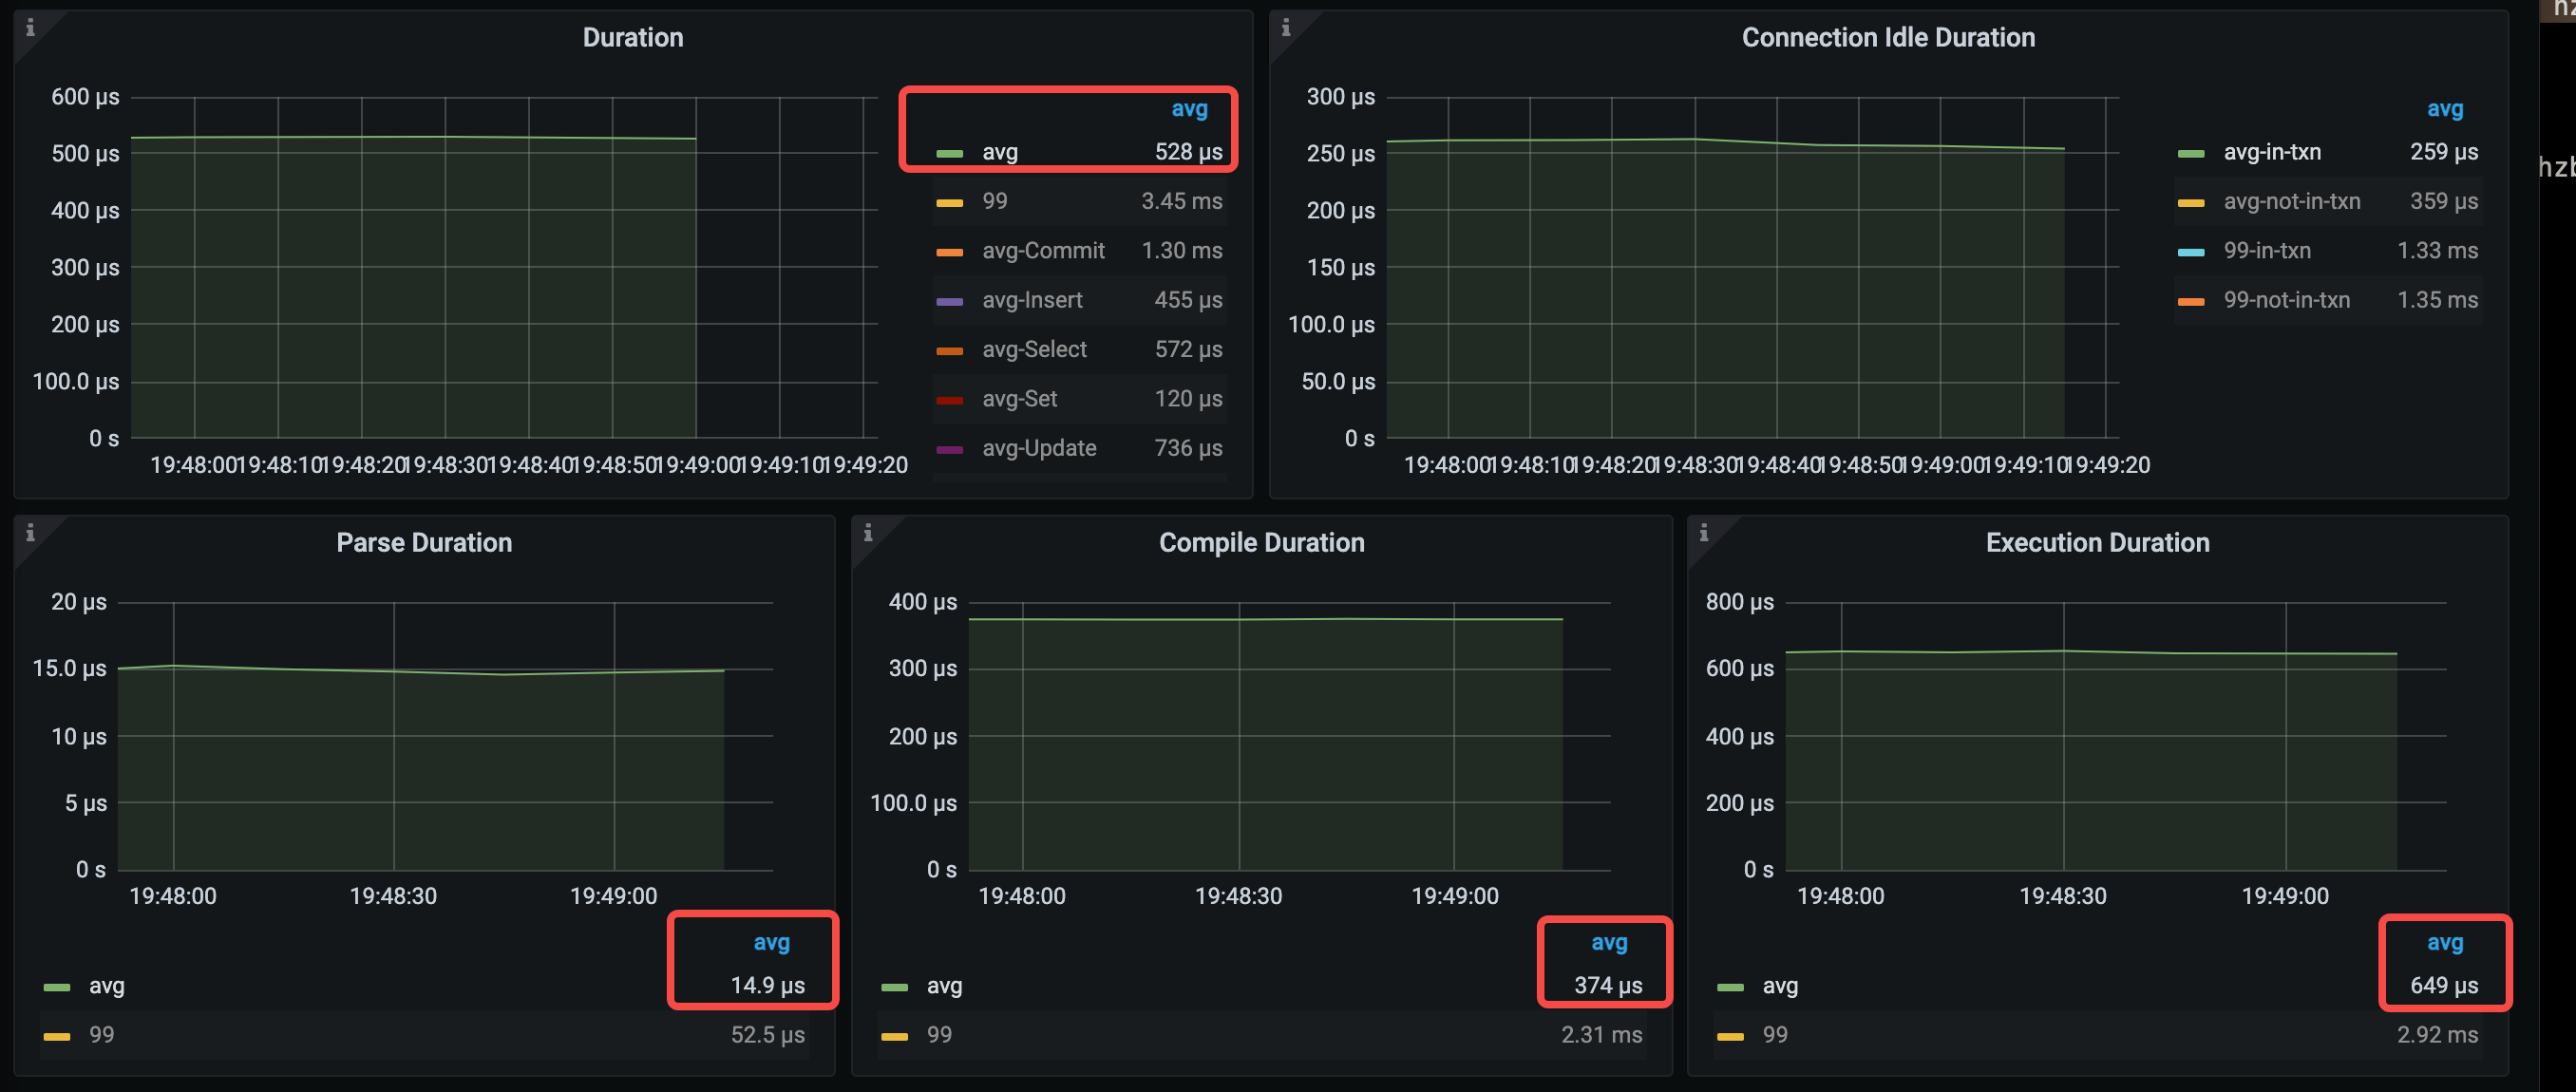
- avg query duration = 528μs (from 1.12ms to 528μs)
- avg parse duration = 14.9μs (from 84.7μs to 14.9μs)
- avg compile duration = 374μs (from 370μs to 374μs)
- avg execution duration = 649μs (from 626μs to 649μs)
Analysis conclusion
Unlike Scenario 2, the application in Scenario 3 enables the Prepared Statement interface but still fails to hit the cache. In addition, Scenario 2 has only one CPS By Type command type (Query), while Scenario 3 has three more command types (StmtPrepare, StmtExecute, StmtClose). Compared with Scenario 2, Scenario 3 has two more network round-trip delays.
- Analysis for the decrease in QPS: From the CPS By Type pane, you can see that Scenario 2 has only one CPS By Type command type (
Query), while Scenario 3 has three more command types (StmtPrepare,StmtExecute,StmtClose).StmtPrepareandStmtCloseare non-conventional commands that are not counted by QPS, so QPS is reduced. The non-conventional commandsStmtPrepareandStmtCloseare counted in thegeneralSQL type, sogeneraltime is displayed in the database overview of Scenario 3, and it accounts for more than a quarter of the database time. - Analysis for the significant decrease in average query duration: for the
StmtPrepareandStmtClosecommand types newly added in Scenario 3, their query duration is calculated separately in the TiDB internal processing. TiDB executes these two types of commands very quickly, so the average query duration is significantly reduced.
Although Scenario 3 uses the Prepared Statement interface, the execution plan cache is still not hit, because many application frameworks call the StmtClose method after StmtExecute to prevent memory leaks. Starting from v6.0.0, you can set the global variable tidb_ignore_prepared_cache_close_stmt=on;. After that, TiDB will not clear the cached execution plans even if the application calls the StmtClose method, so the next SQL execution can reuse the existing execution plan and avoid compiling the execution plan repeatedly.
Scenario 4. Use the Prepared Statement interface and enable execution plan caching
Application configuration
The application configuration remains the same as that of Scenario 3. To resolve the issue of not hitting the cache even if the application triggers StmtClose, the following parameters are configured.
- Set the TiDB global variable
set global tidb_ignore_prepared_cache_close_stmt=on;(introduced since TiDB v6.0.0,offby default). - Set the TiDB configuration item
prepared-plan-cache: {enabled: true}to enable the plan cache feature.
Performance analysis
TiDB Dashboard
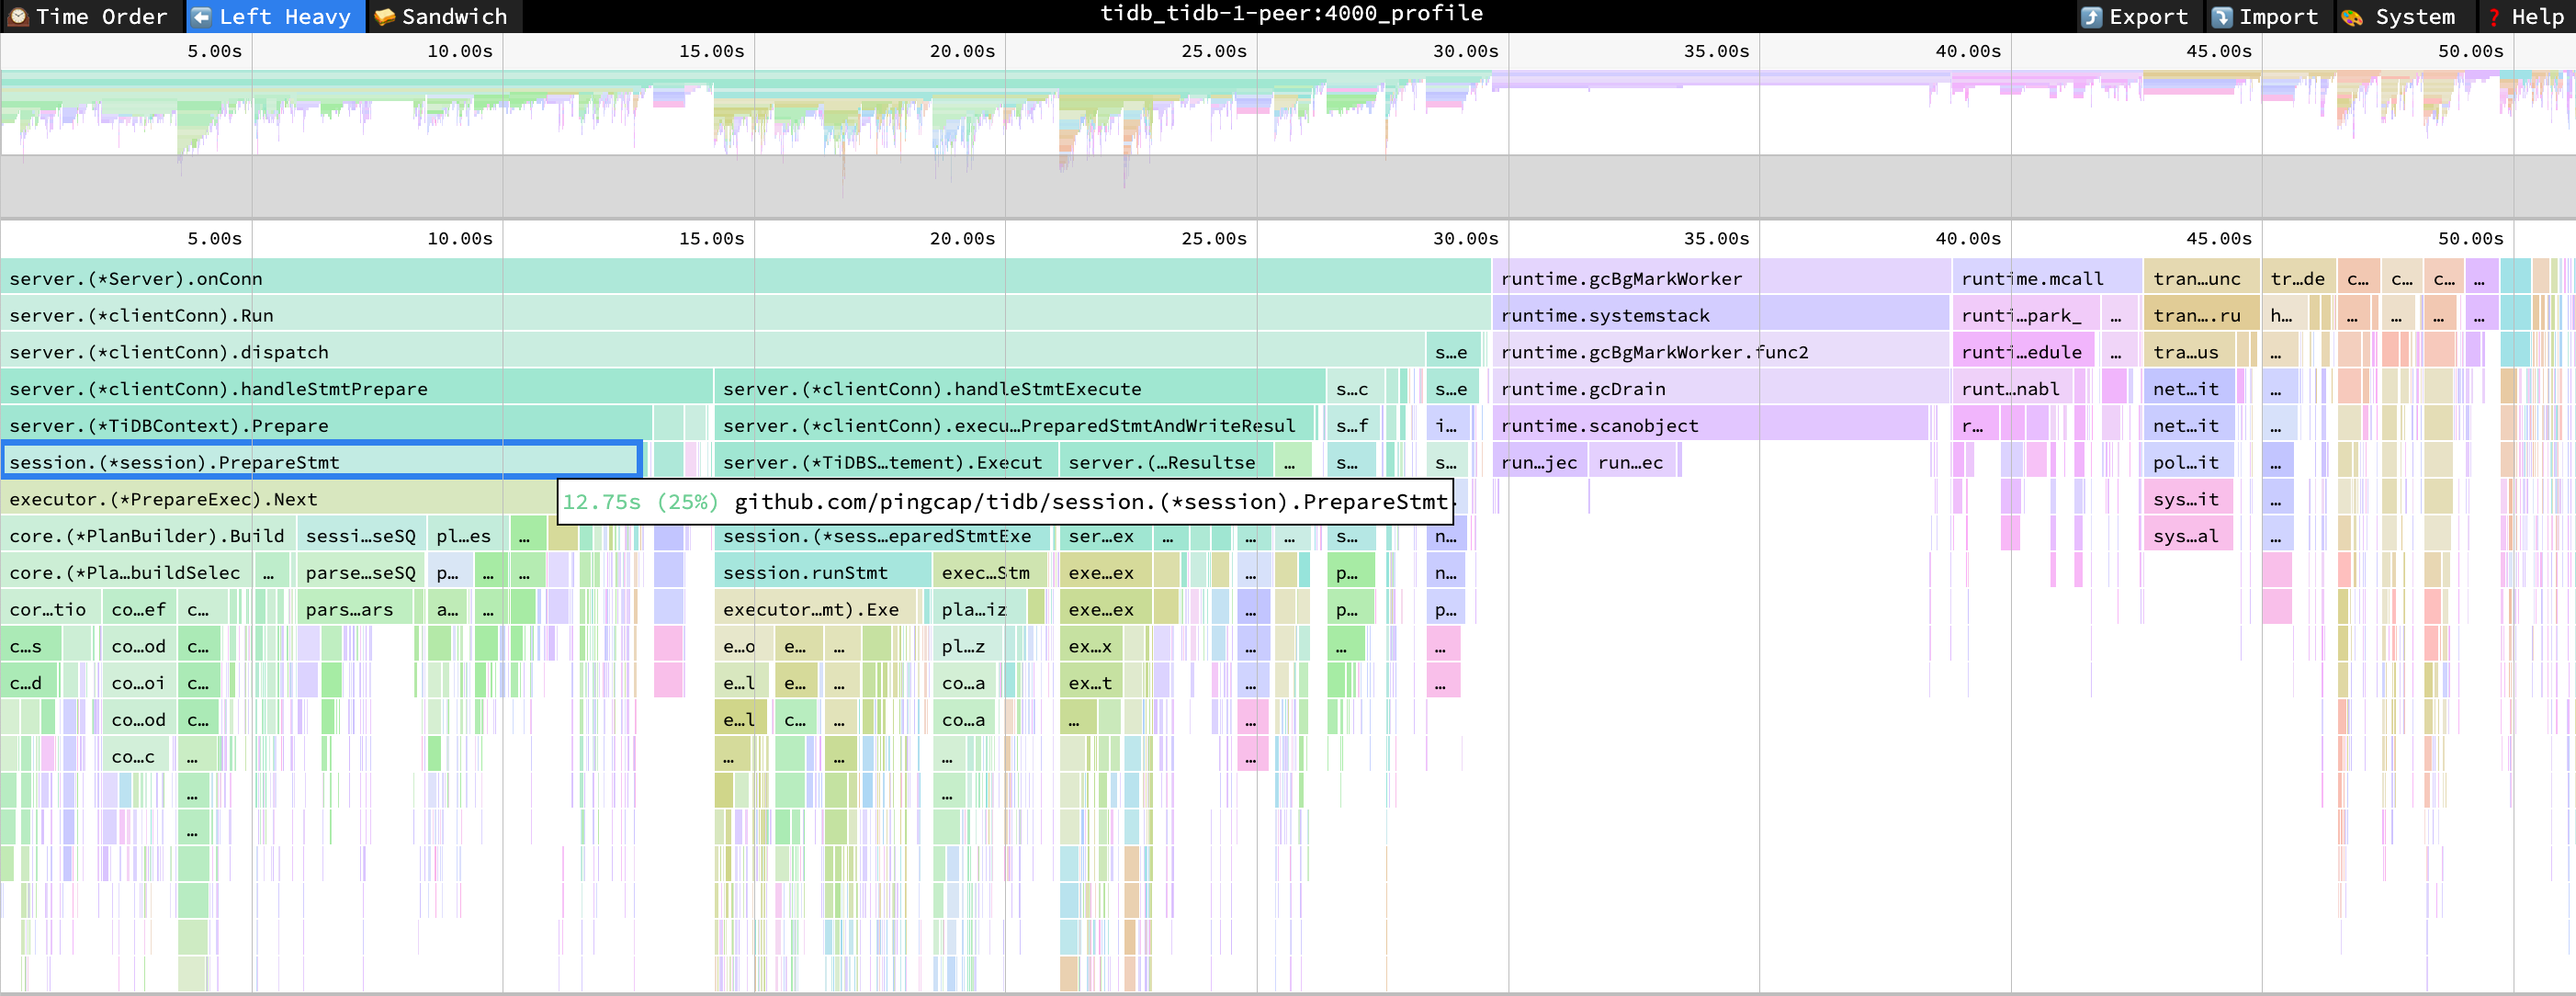
From the flame chart of the TiDB CPU usage, you can see that CompileExecutePreparedStmt and Optimize have no significant CPU consumption. 25% of the CPU is consumed by the Prepare command, which contains parsing-related functions of Prepare such as PlanBuilder and parseSQL.
PreparseStmt cpu = 25% cpu time = 12.75s
Performance Overview dashboard
In the Performance Overview dashboard, the most significant change is the average time of the compile phase, which is reduced from 8.95 seconds per second in Scenario 3 to 1.18 seconds per second. The number of queries using the execution plan cache is roughly equal to the value of StmtExecute. With the increase in QPS, the database time consumed by Select statements per second decreases, and the database time consumed by general statements per second type increases.
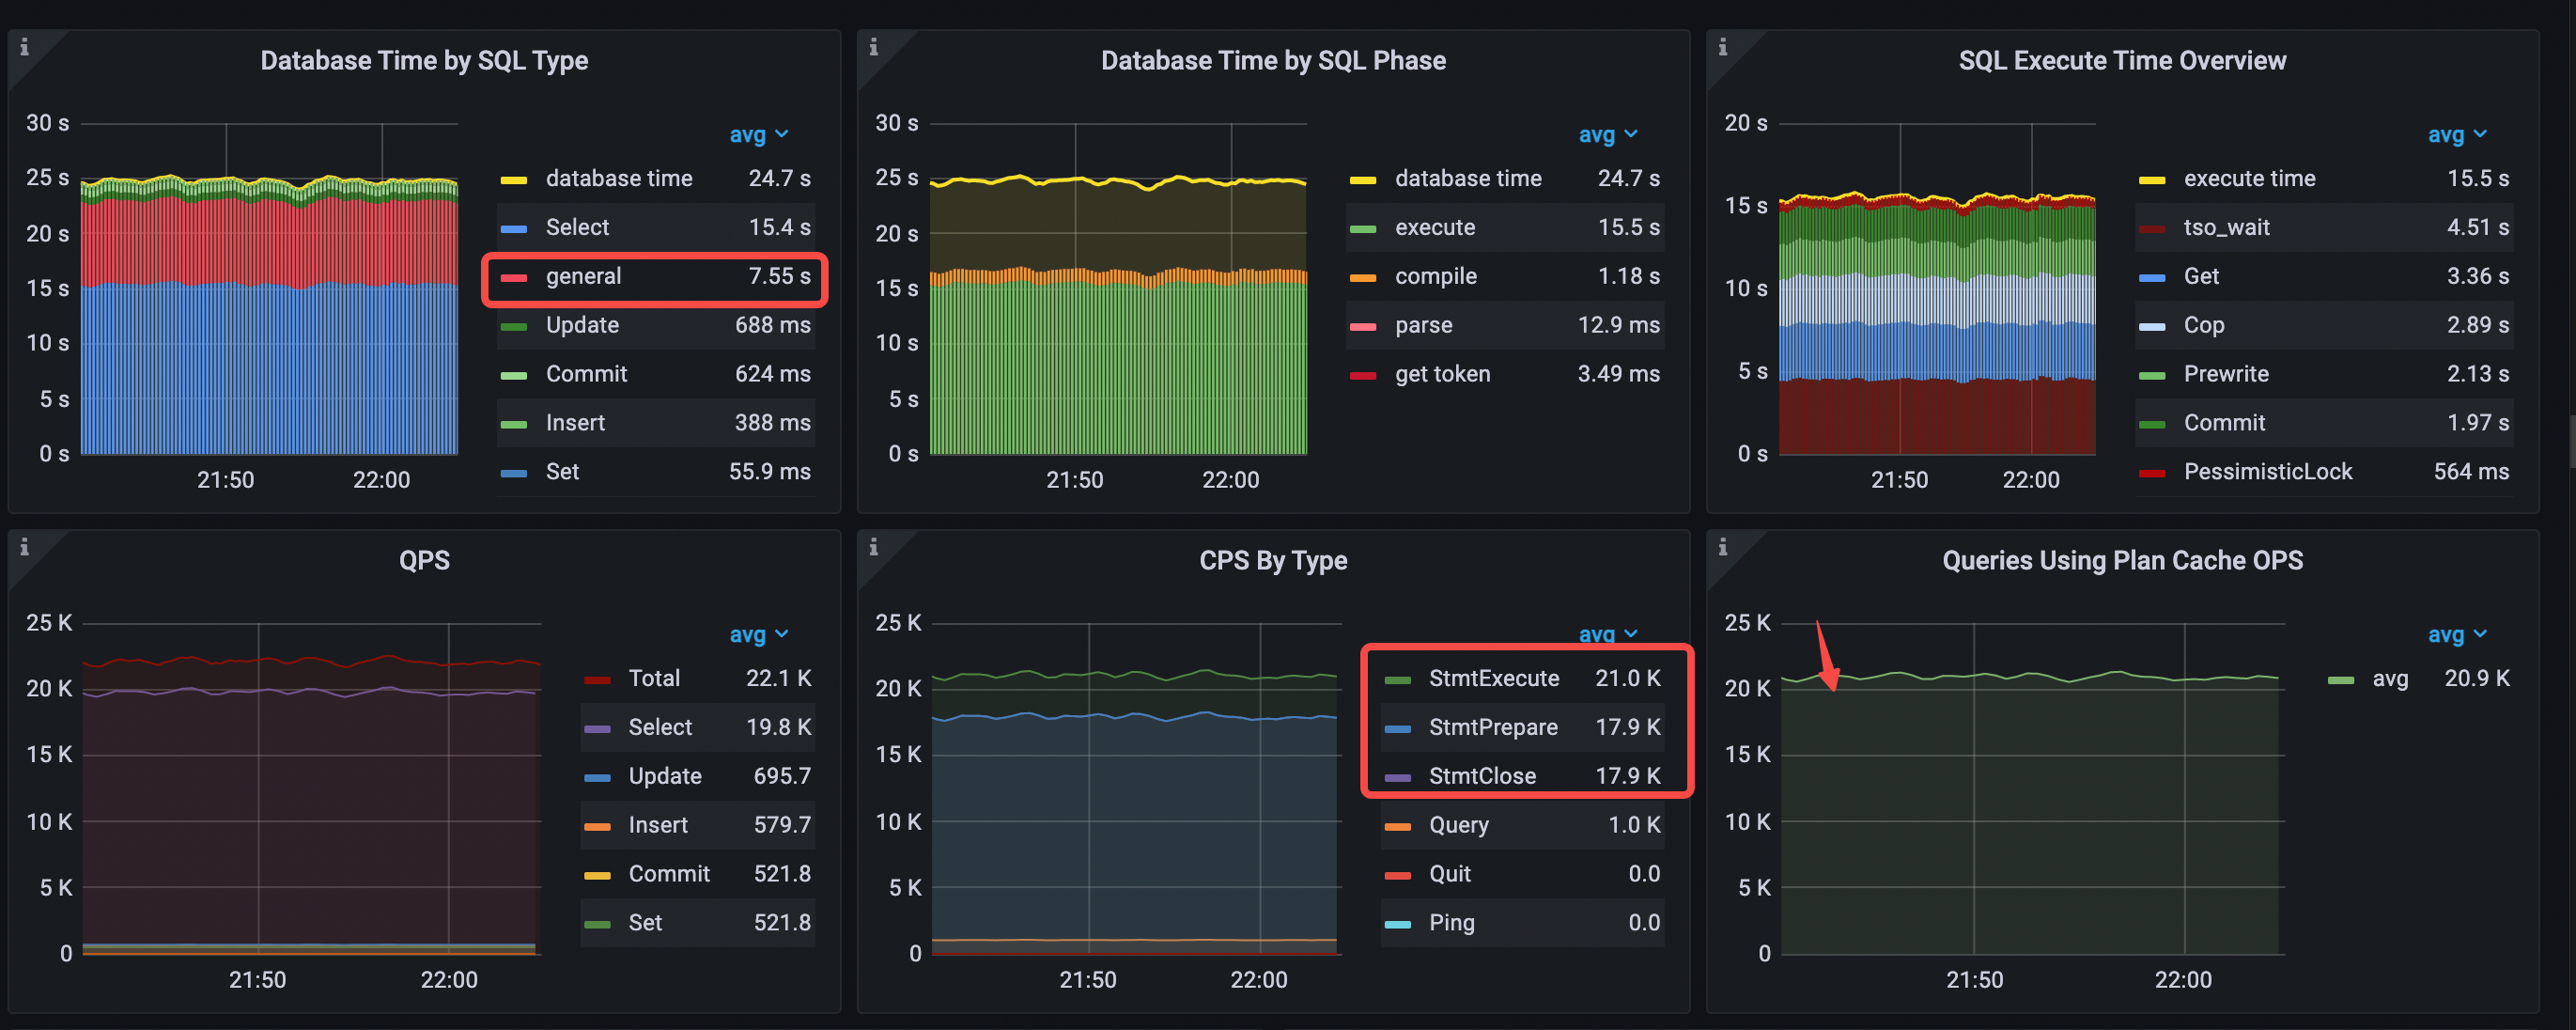
- Database Time by SQL Type: the
Selectstatement type takes the most time. - Database Time by SQL Phase: the
executephase takes most of the time. - SQL Execute Time Overview:
tso wait,Get, andCoptake most of the time. - Execution plan cache is hit. The value of Queries Using Plan Cache OPS roughly equals
StmtExecuteper second. - CPS By Type: 3 types of commands (same as Scenario 3)
- Compared with scenario 3, the time consumed by
generalstatements is longer because the QPS is increased. - avg QPS = 22.1k (from 19.7k to 22.1k)
The average TiDB CPU utilization drops from 936% to 827%.

The average compile time drops significantly, from 374 us to 53.3 us. Because the QPS increases, the average execute time increases too.
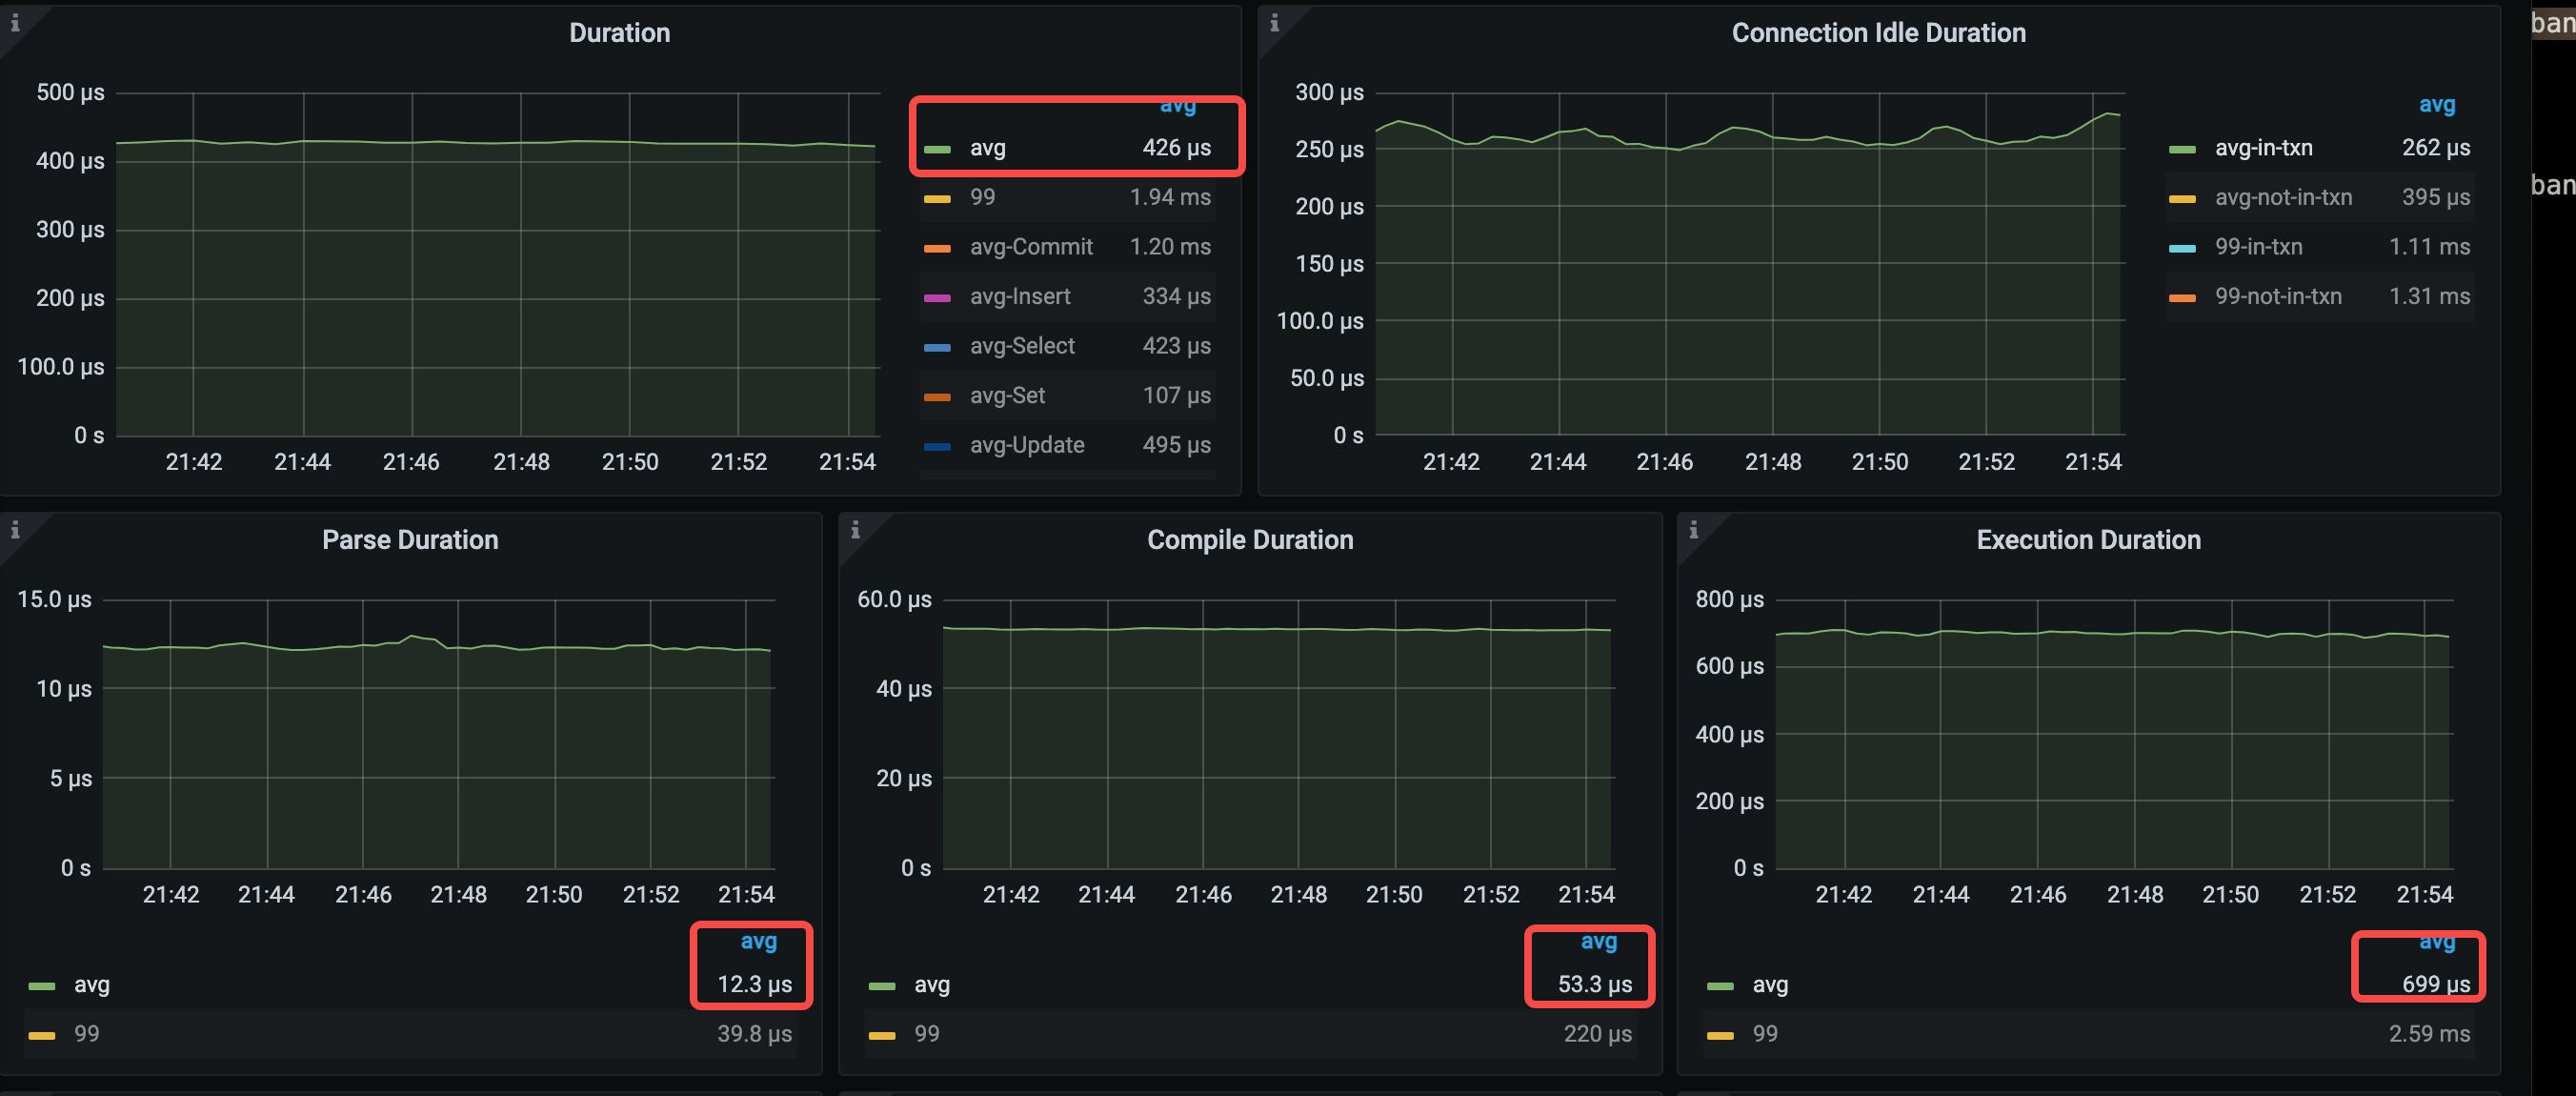
- avg query duration = 426μs (from 528μs to 426μs)
- avg parse duration = 12.3μs (from 14.8μs to 12.3μs)
- avg compile duration = 53.3μs (from 374μs to 53.3μs)
- avg execution duration = 699μs (from 649μs to 699us)
Analysis conclusion
Compared with Scenario 3, Scenario 4 also uses 3 command types. The difference is that Scenario 4 hits the execution plan cache, which reduces compile duration greatly, reduces the query duration, and improves QPS.
Because the StmtPrepare and StmtClose commands consume significant database time and increase the number of interactions between the application and TiDB each time the application executes a SQL statement. The next scenario will further tune the performance by eliminating the calls of these two commands through JDBC configurations.
Scenario 5. Cache prepared objects on the client side
Application configuration
Compared with Scenario 4, 3 new JDBC parameters cachePrepStmts=true&prepStmtCacheSize=1000&prepStmtCacheSqlLimit=20480 are configured, as explained below.
cachePrepStmts = true: caches Prepared Statement objects on the client side, which eliminates the calls of StmtPrepare and StmtClose.prepStmtCacheSize: the value must be greater than 0.prepStmtCacheSqlLimit: the value must be greater than the length of the SQL text.
In Scenario 5, the complete JDBC configurations are as follows.
useServerPrepStmts=true&cachePrepStmts=true&prepStmtCacheSize=1000&prepStmtCacheSqlLimit=20480&useConfigs=maxPerformance
Performance analysis
TiDB Dashboard
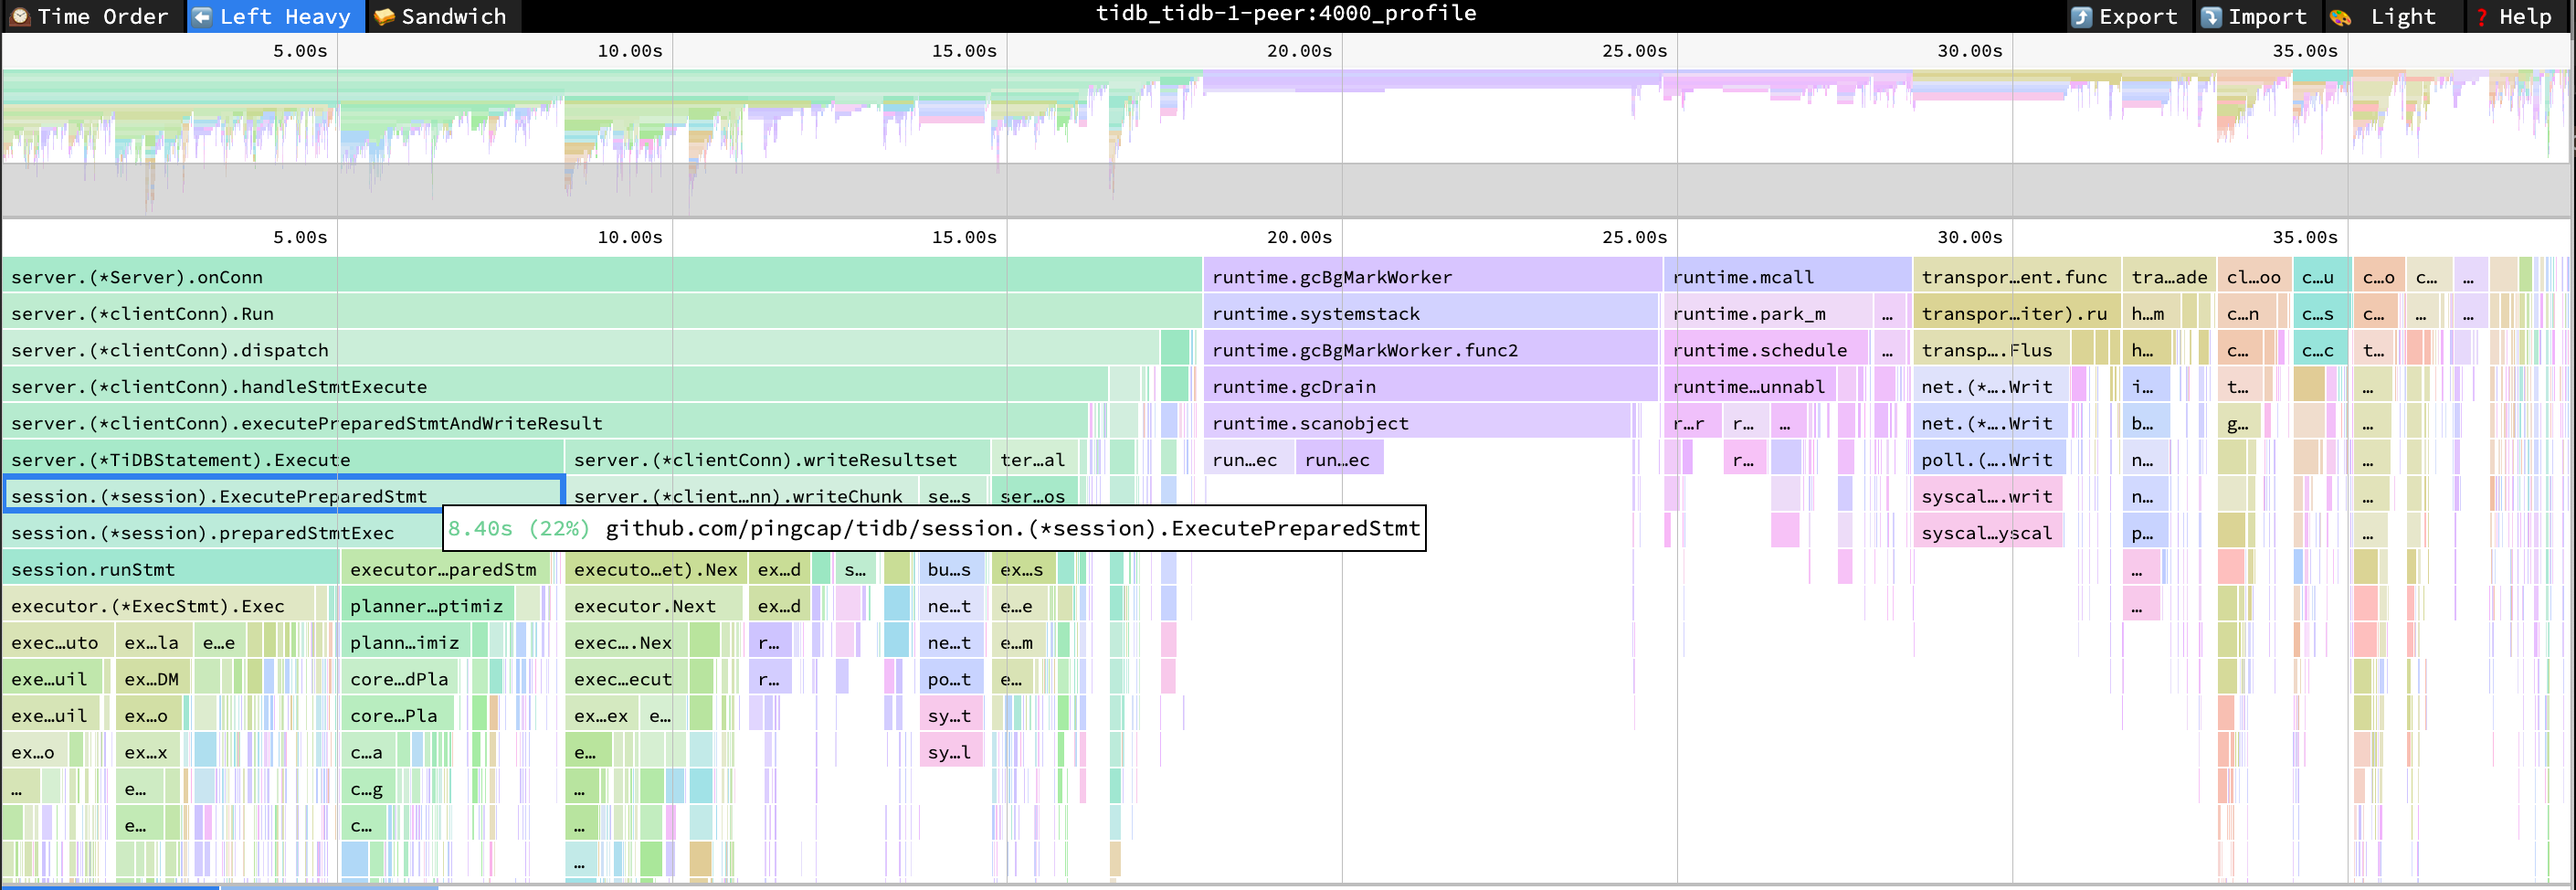
From the following flame chart of TiDB, you can see that the high CPU consumption of the Prepare command is no longer present.
- ExecutePreparedStmt cpu = 22% cpu time = 8.4s
Performance Overview dashboard
In the Performance Overview dashboard, the most notable changes are that the three Stmt command types in the CPS By Type pane drop to one type, the general statement type in the Database Time by SQL Type pane is disappeared, and the QPS in the QPS pane increases to 30.9k.
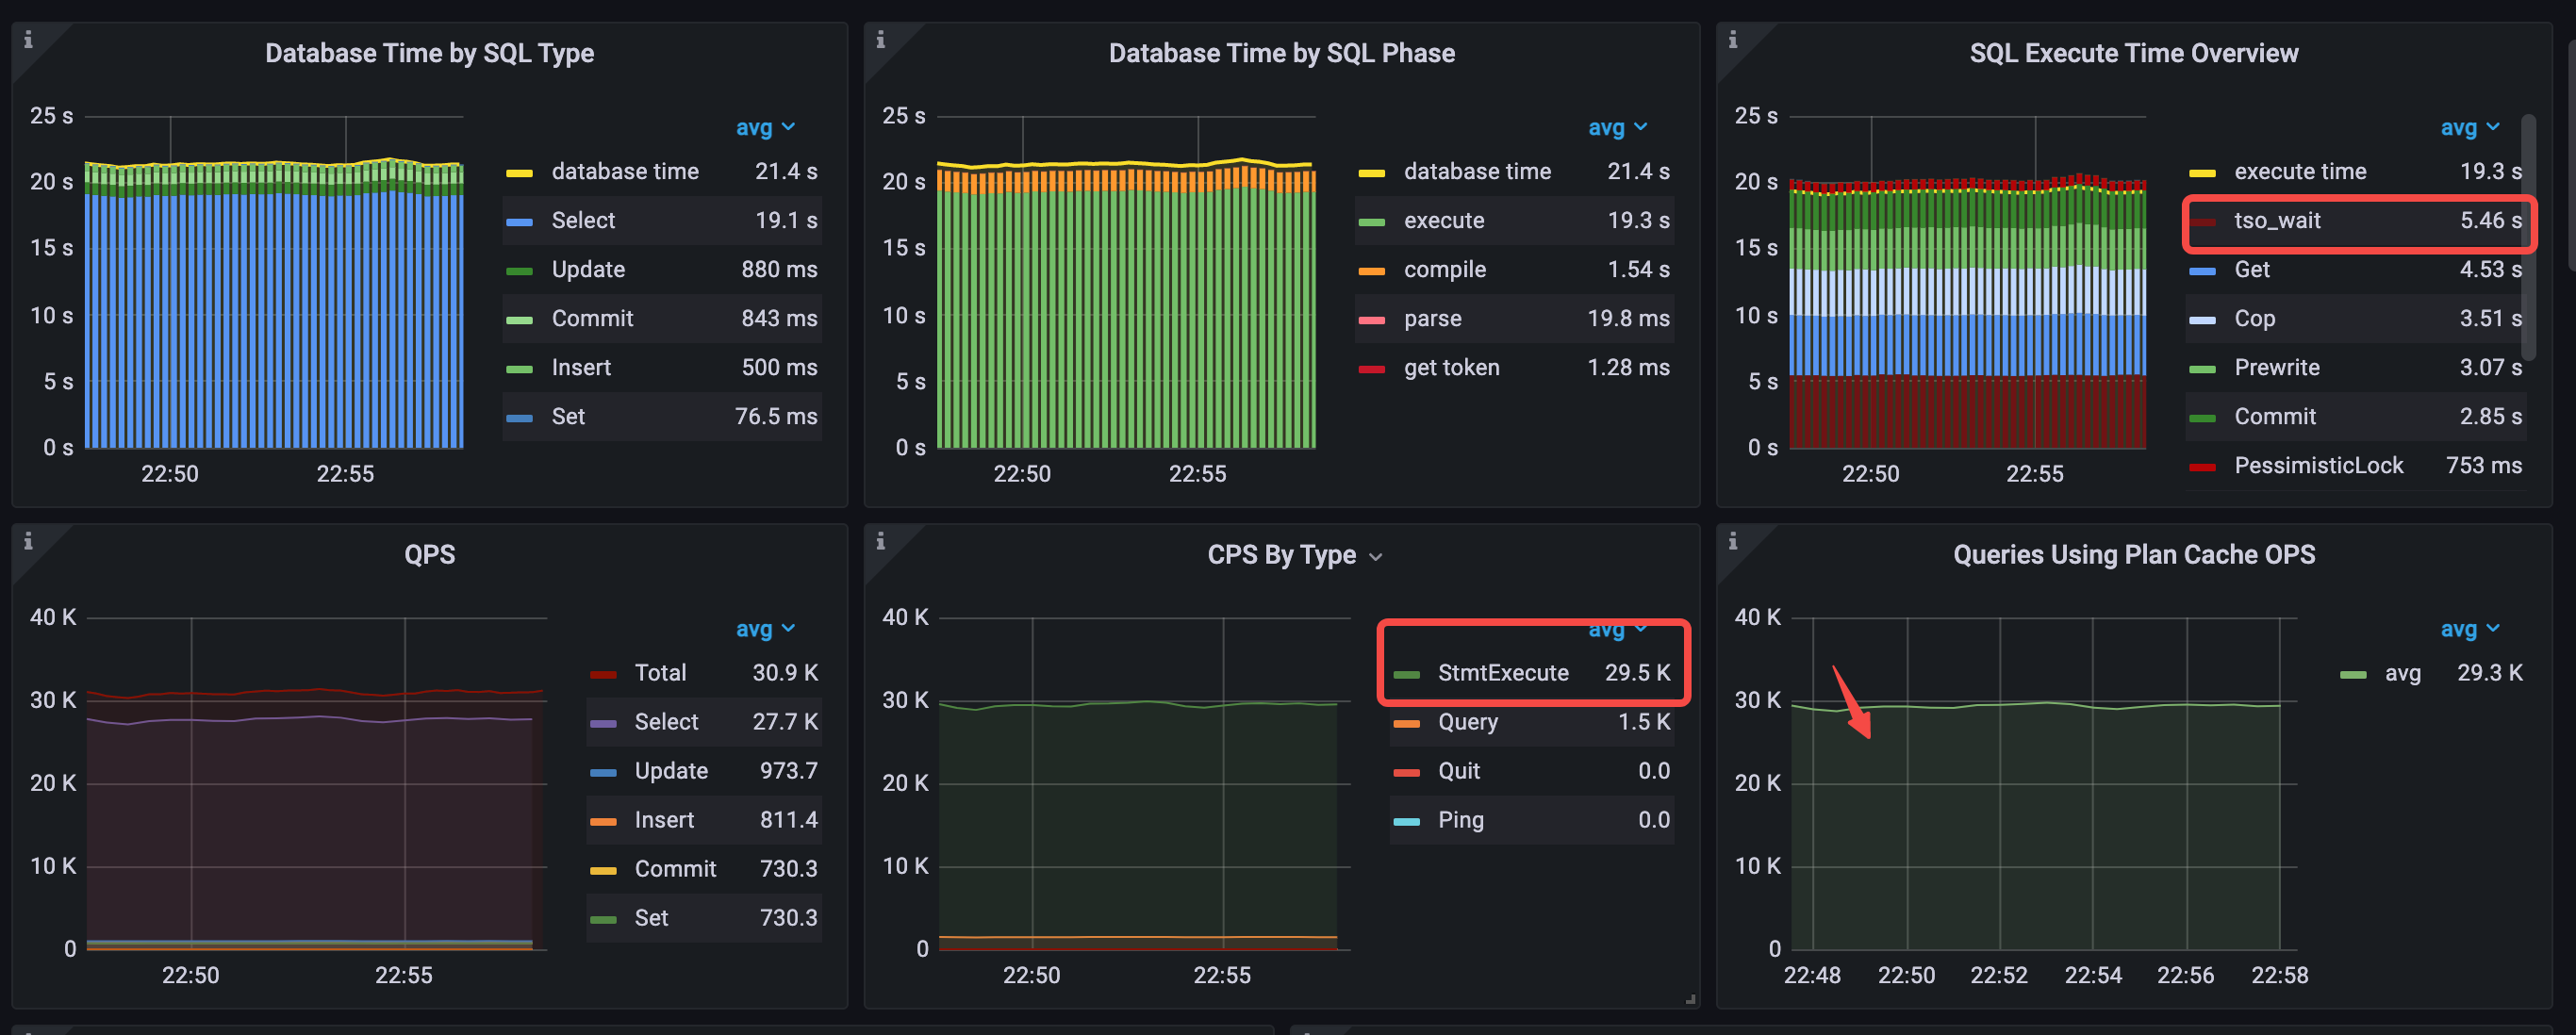
- Database Time by SQL Type: the
Selectstatement type takes most of the time and thegeneralstatement type disappears. - Database Time by SQL Phase: the
executephase takes most of the time. - SQL Execute Time Overview:
tso wait,Get, andCoptake most of the time. - Execution plan cache is hit. The value of Queries Using Plan Cache OPS roughly equals
StmtExecuteper second. - CPS By Type: only the
StmtExecutecommand is used. - avg QPS = 30.9k (from 22.1k to 30.9k)
The average TiDB CPU utilization drops from 827% to 577%. As the QPS increases, the average TiKV CPU utilization increases to 313%.

The key latency metrics are as follows:
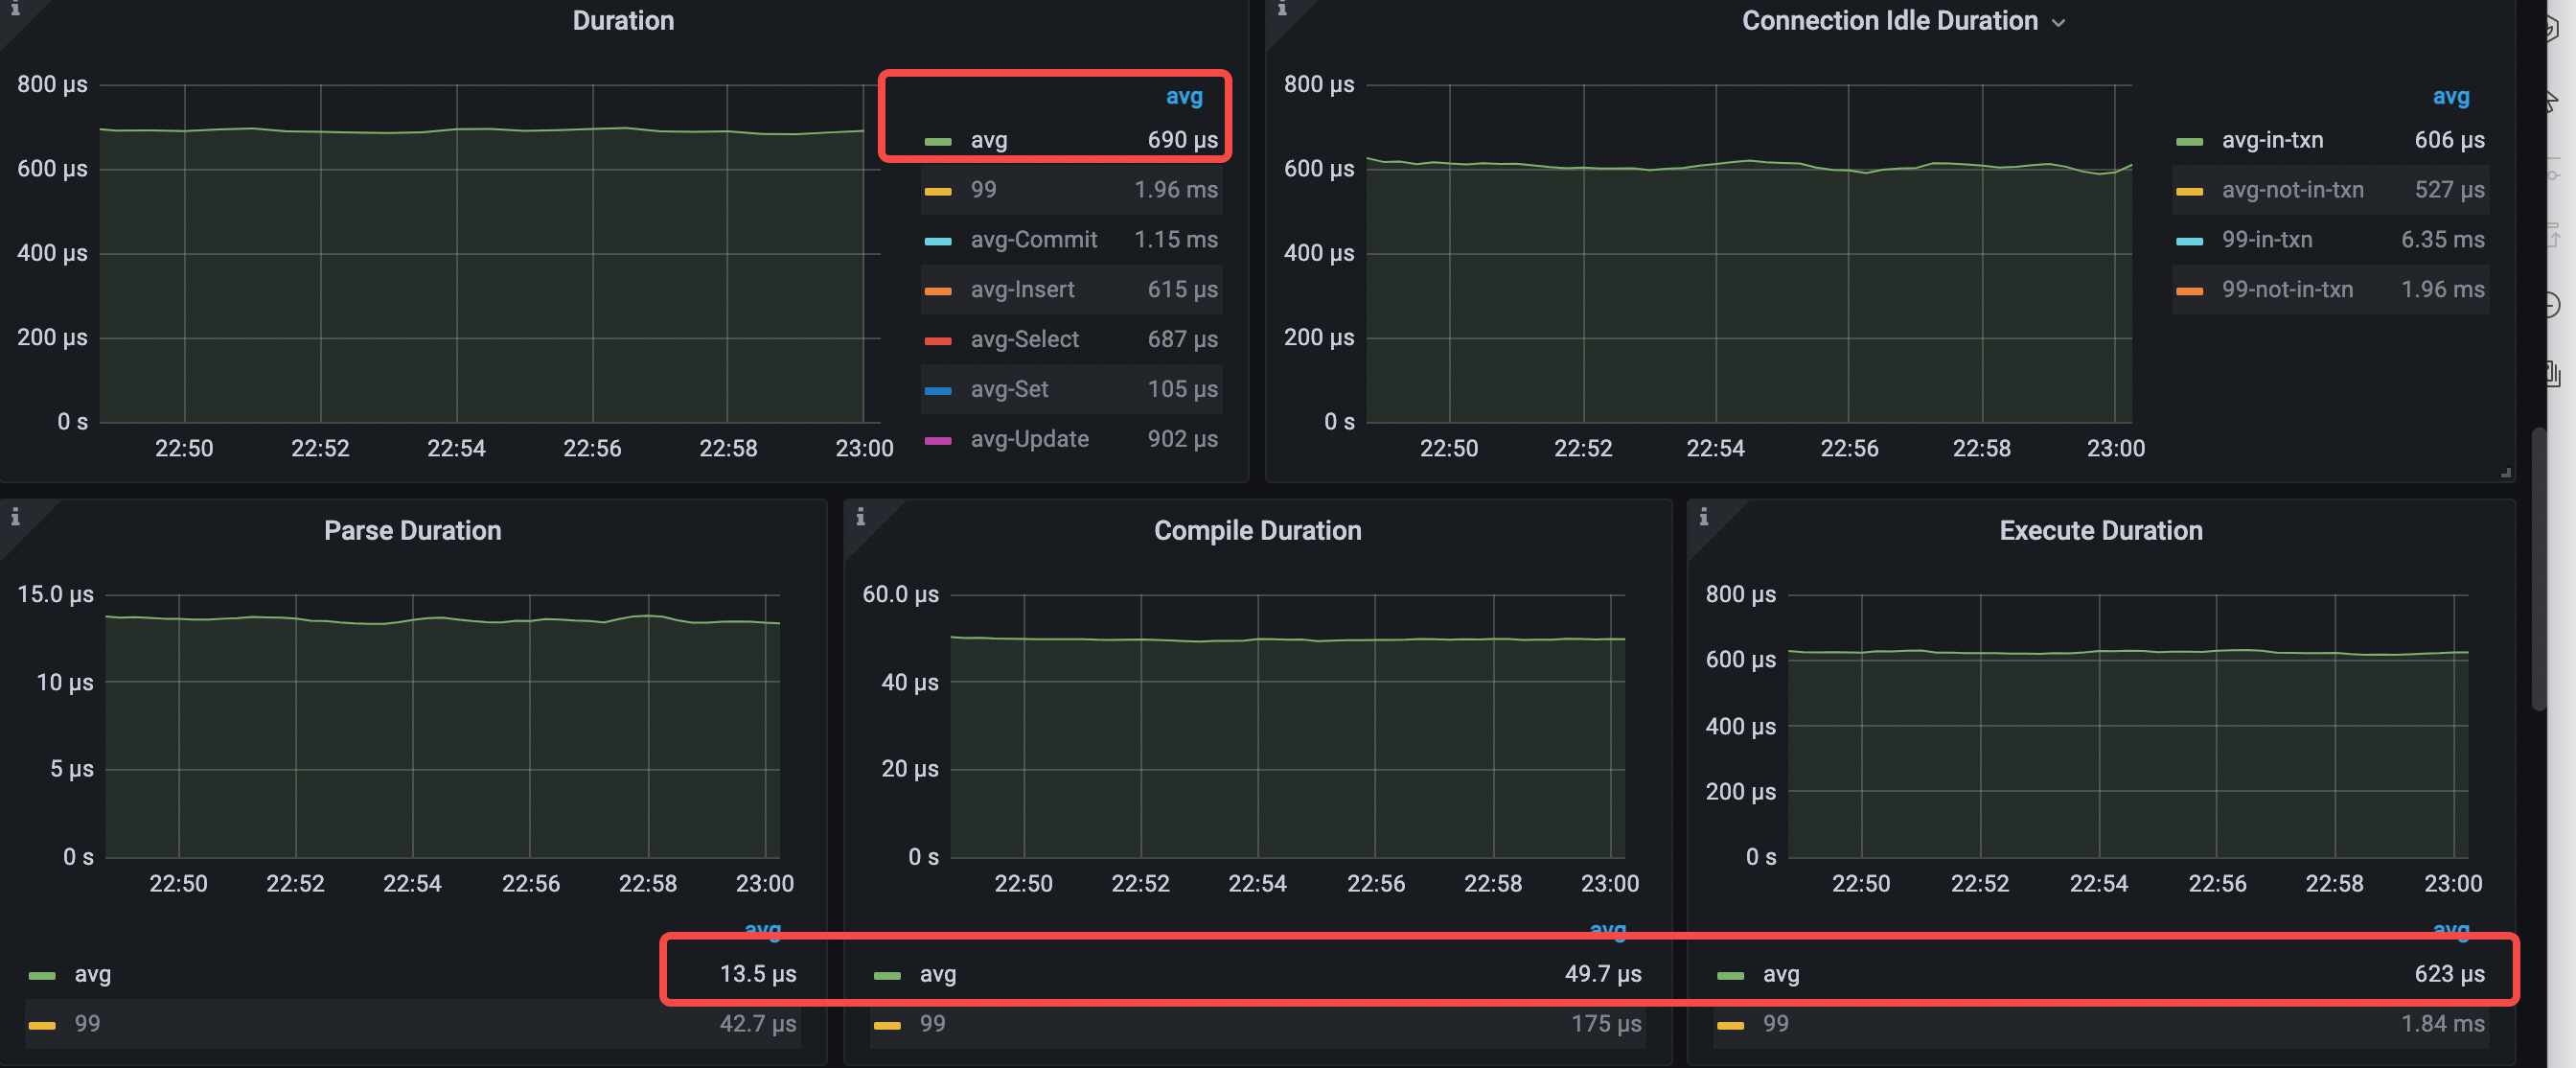
- avg query duration = 690μs (from 426μs to 690μs)
- avg parse duration = 13.5μs (from 12.3μs to 13.5μs )
- avg compile duration = 49.7μs (from 53.3μs to 49.7μs)
- avg execution duration = 623μs (from 699us to 623μs)
- avg pd tso wait duration = 196μs (from 224μs to 196μs)
- connection idle duration avg-in-txn = 608μs (from 250μs to 608μs)
Analysis conclusion
- Compared with Scenario 4, the CPS By Type pane in Scenario 5 has the
StmtExecutecommand only, which avoids two network round trips and increases the overall system QPS. - In the case of QPS increase, the latency decreases in terms of parse duration, compile duration, and execution duration, but the query duration increases instead. This is because TiDB processes
StmtPrepareandStmtClosevery quickly, and eliminating these two command types increases the average query duration. - In Database Time by SQL Phase,
executetakes the most time and is close to the database time. While in SQL Execute Time Overview,tso waittakes most of the time, and more than a quarter ofexecutetime is taken to wait for TSO. - The total
tso waittime per second is 5.46s. The averagetso waittime is 196 us, and the number oftso cmdtimes per second is 28k, which is very close to the QPS of 30.9k. This is because according to the implementation of theread committedisolation level in TiDB, every SQL statement in a transaction needs to request TSO from PD.
TiDB v6.0 provides rc read, which optimizes the read committed isolation level by reducing tso cmd. This feature is controlled by the global variable set global tidb_rc_read_check_ts=on;. When this variable is enabled, the default behavior of TiDB acts the same as the repeatable-read isolation level, at which only start-ts and commit-ts need to be obtained from the PD. The statements in a transaction use the start-ts to read data from TiKV first. If the data read from TiKV is earlier than start-ts, the data is returned directly. If the data read from TiKV is later than start-ts, the data is discarded. TiDB requests TSO from PD, and then retries the read. The for update ts of subsequent statements uses the latest PD TSO.
Scenario 6: Enable the tidb_rc_read_check_ts variable to reduce TSO requests
Application configuration
Compared with Scenario 5, the application configuration remains the same. The only difference is that the set global tidb_rc_read_check_ts=on; variable is configured to reduce TSO requests.
Performance analysis
Dashboard
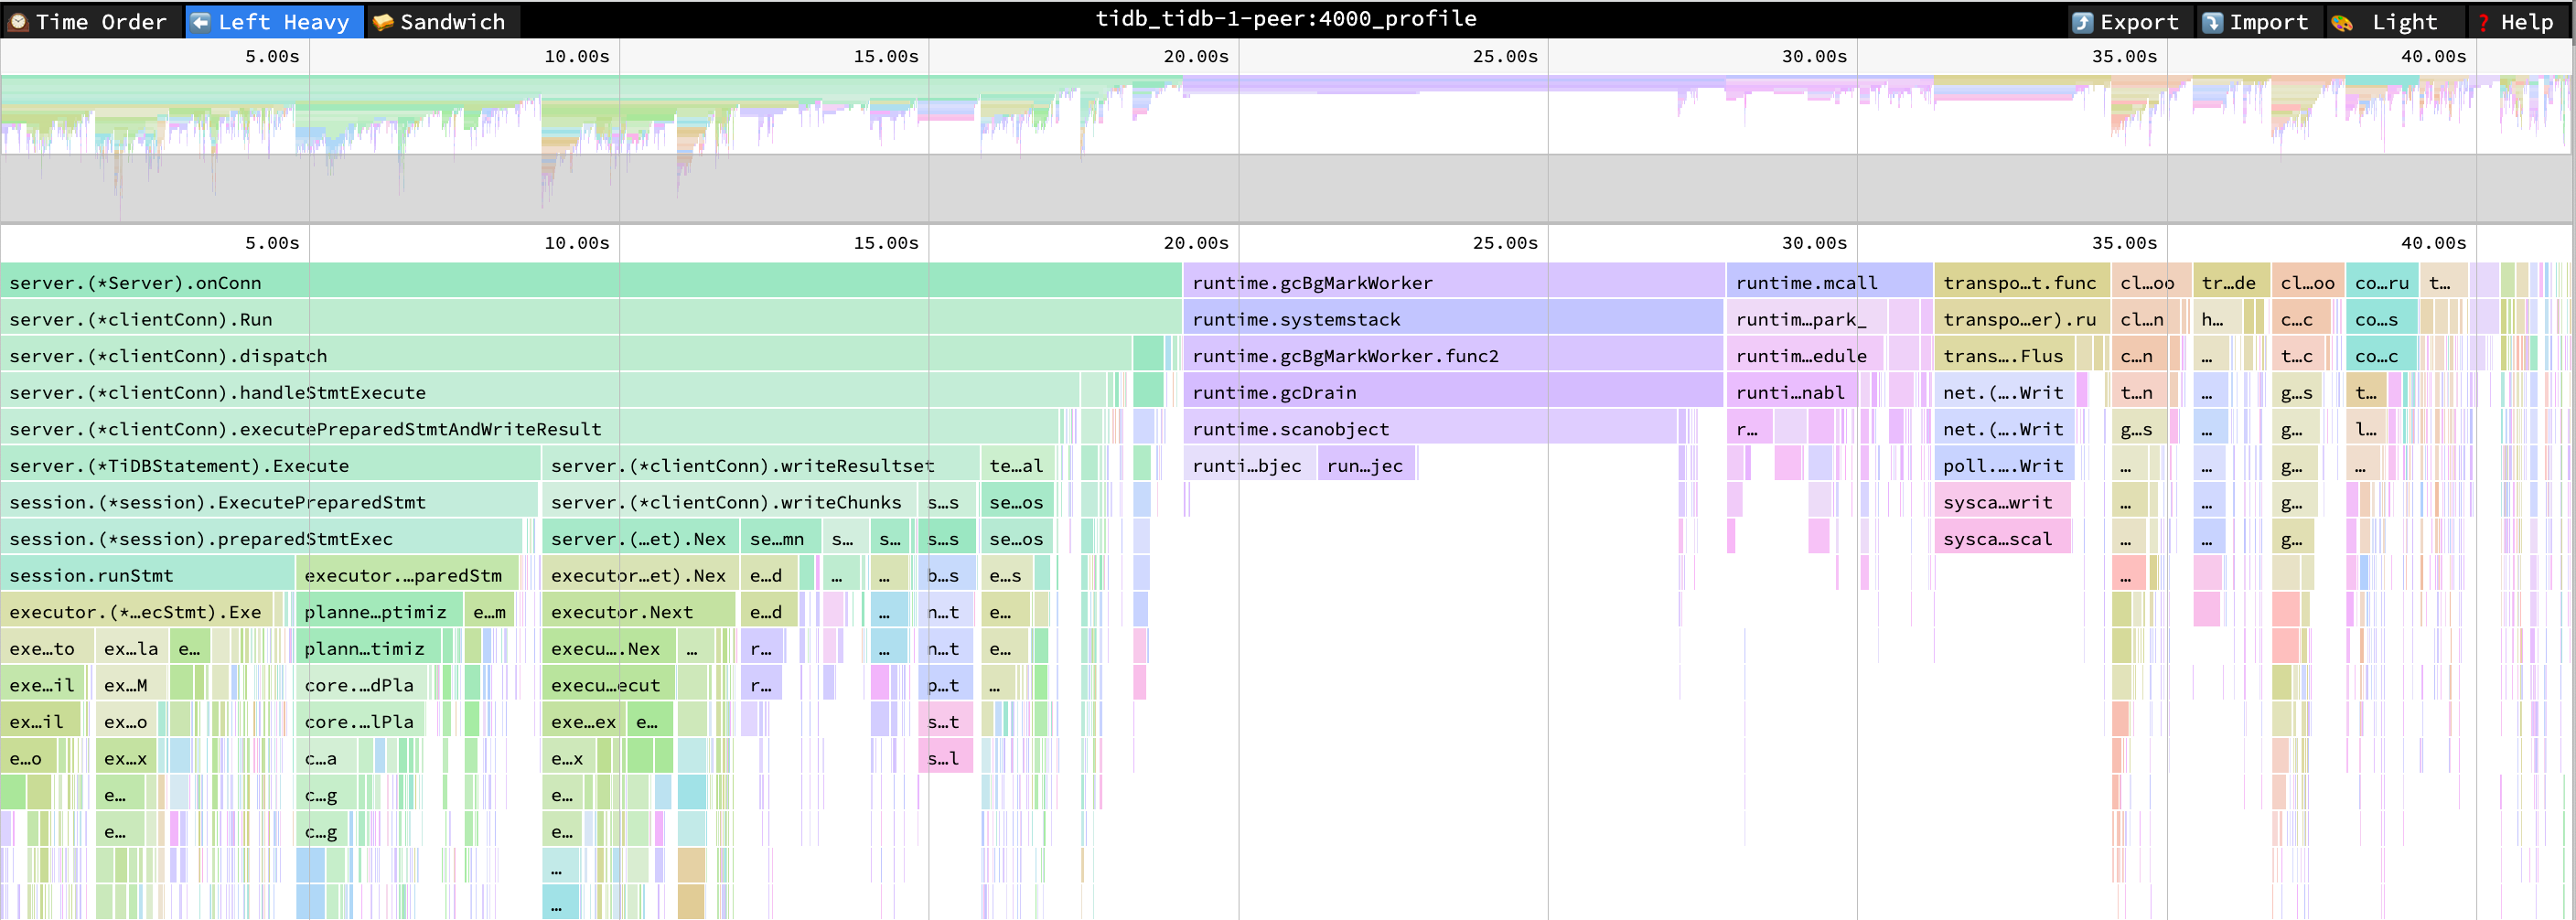
The flame chart of the TiDB CPU does not have any significant changes.
- ExecutePreparedStmt cpu = 22% cpu time = 8.4s
Performance Overview dashboard
After using RC read, QPS increases from 30.9k to 34.9k, and the tso wait time consumed per second decreases from 5.46 s to 456 ms.
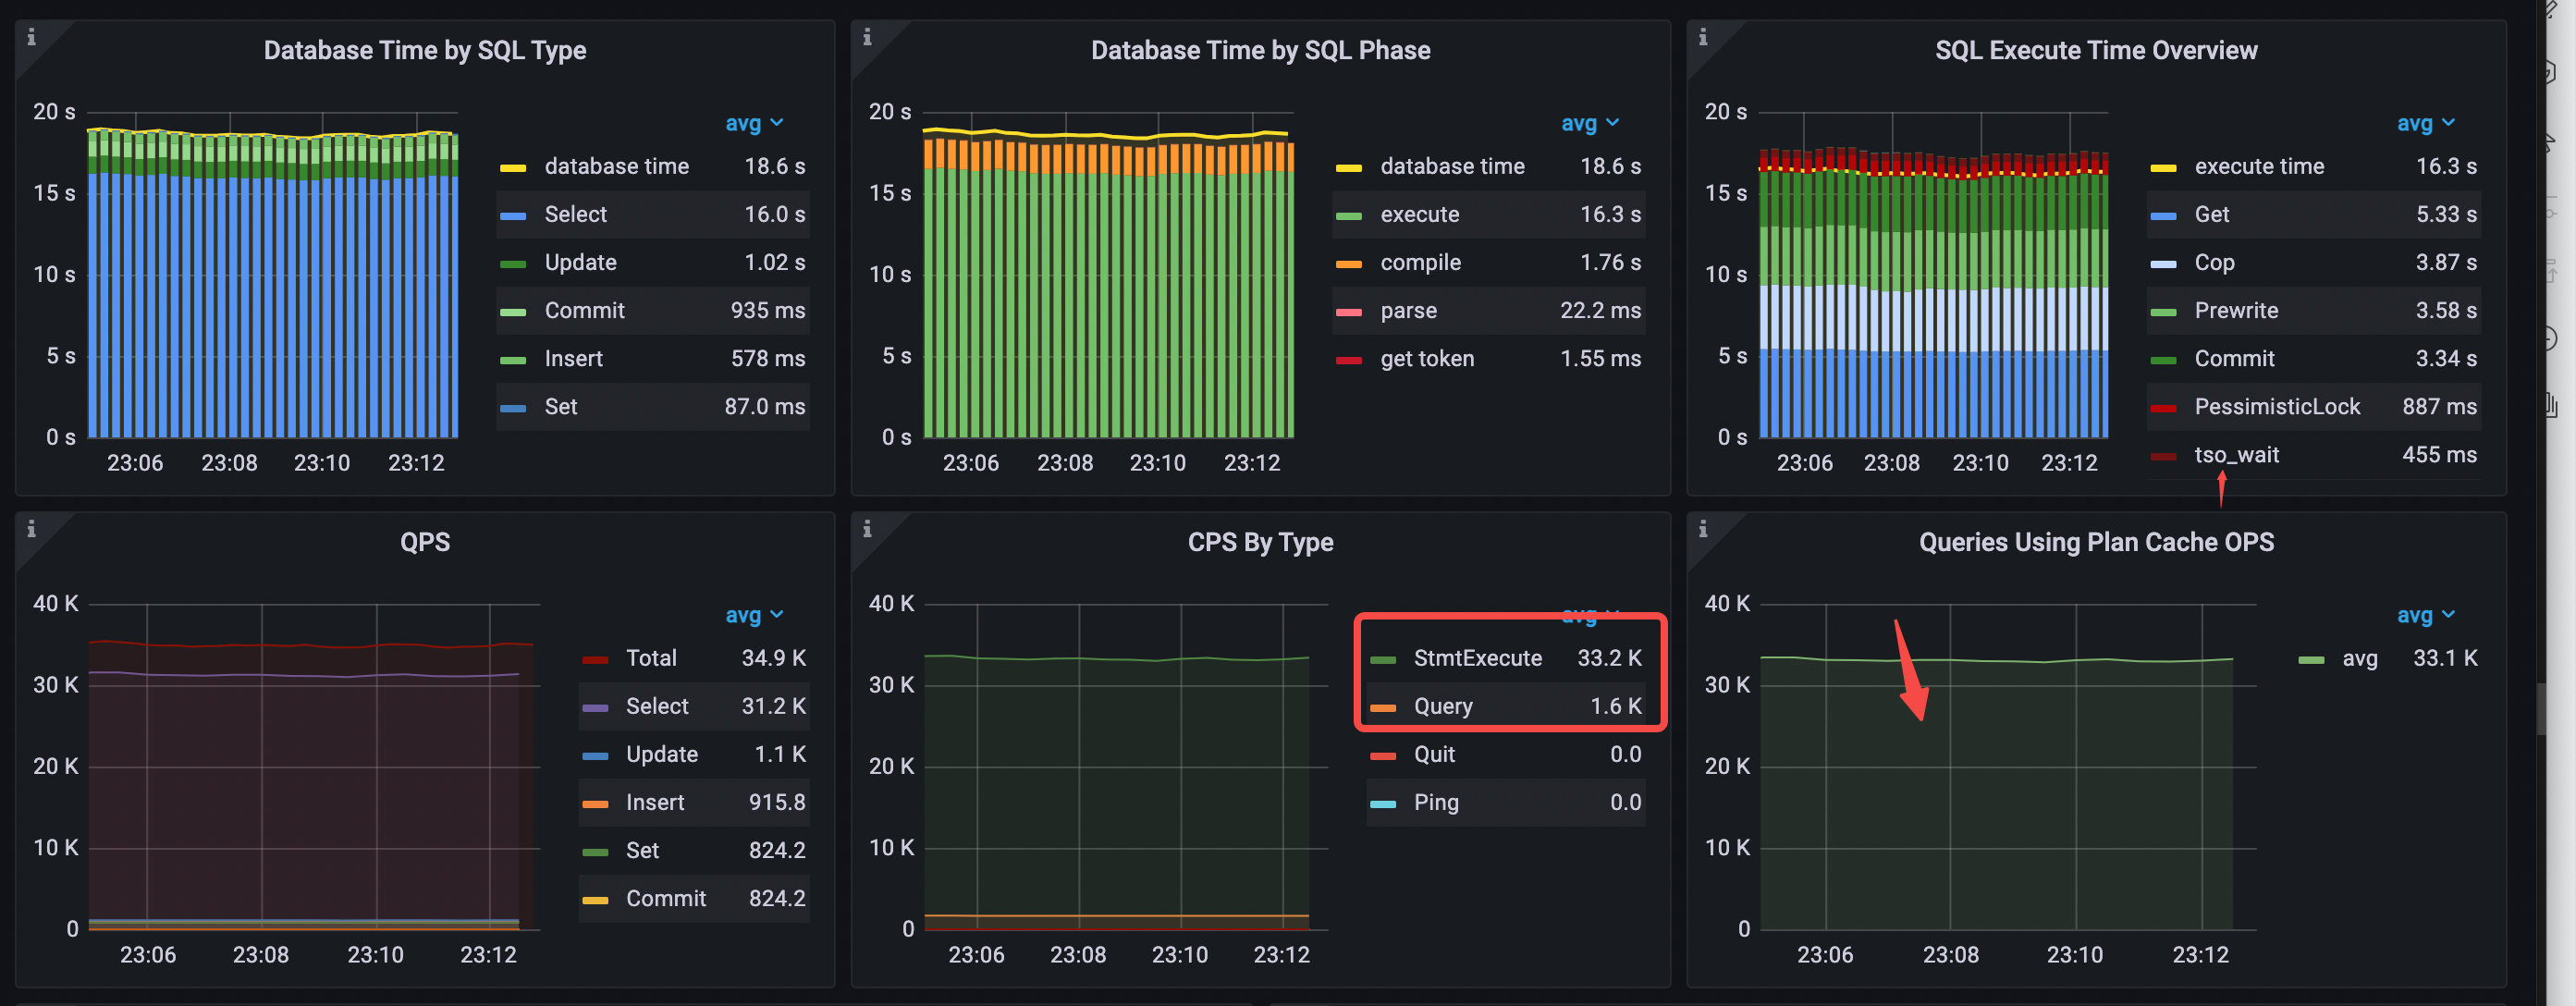
- Database Time by SQL Type: the
Selectstatement type takes most of the time. - Database Time by SQL Phase: the
executephase takes most of the time. - SQL Execute Time Overview:
Get,Cop, andPrewritetake most of the time. - Execution plan cache is hit. The value of Queries Using Plan Cache OPS roughly equals
StmtExecuteper second. - CPS By Type: only the
StmtExecutecommand is used. - avg QPS = 34.9k (from 30.9k to 34.9k)
The tso cmd per second drops from 28.3k to 2.7k.
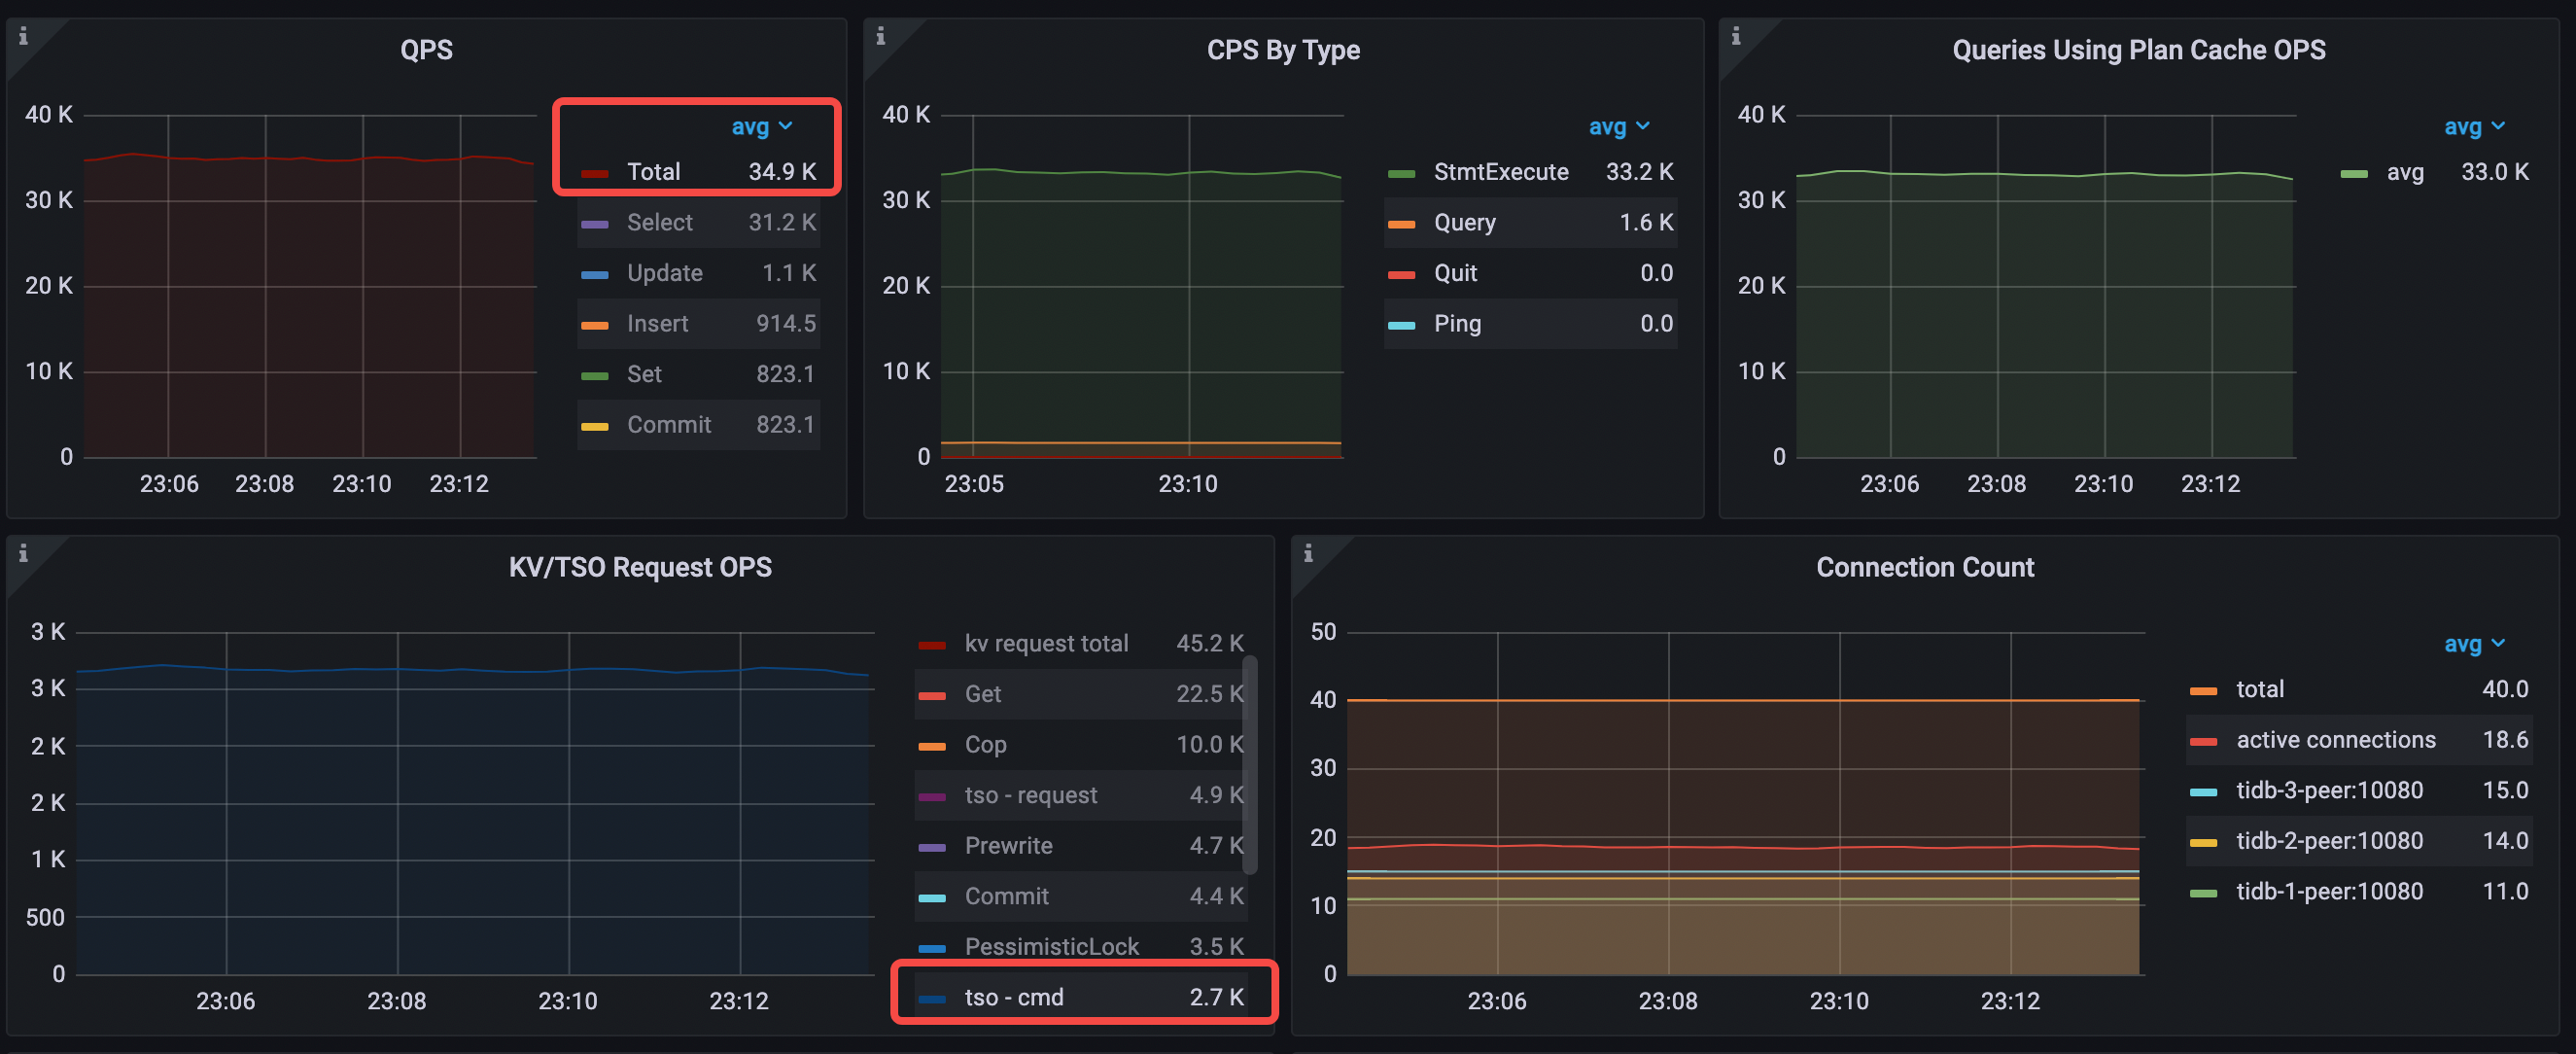
The average TiDB CPU increases to 603% (from 577% to 603%).

The key latency metrics are as follows:
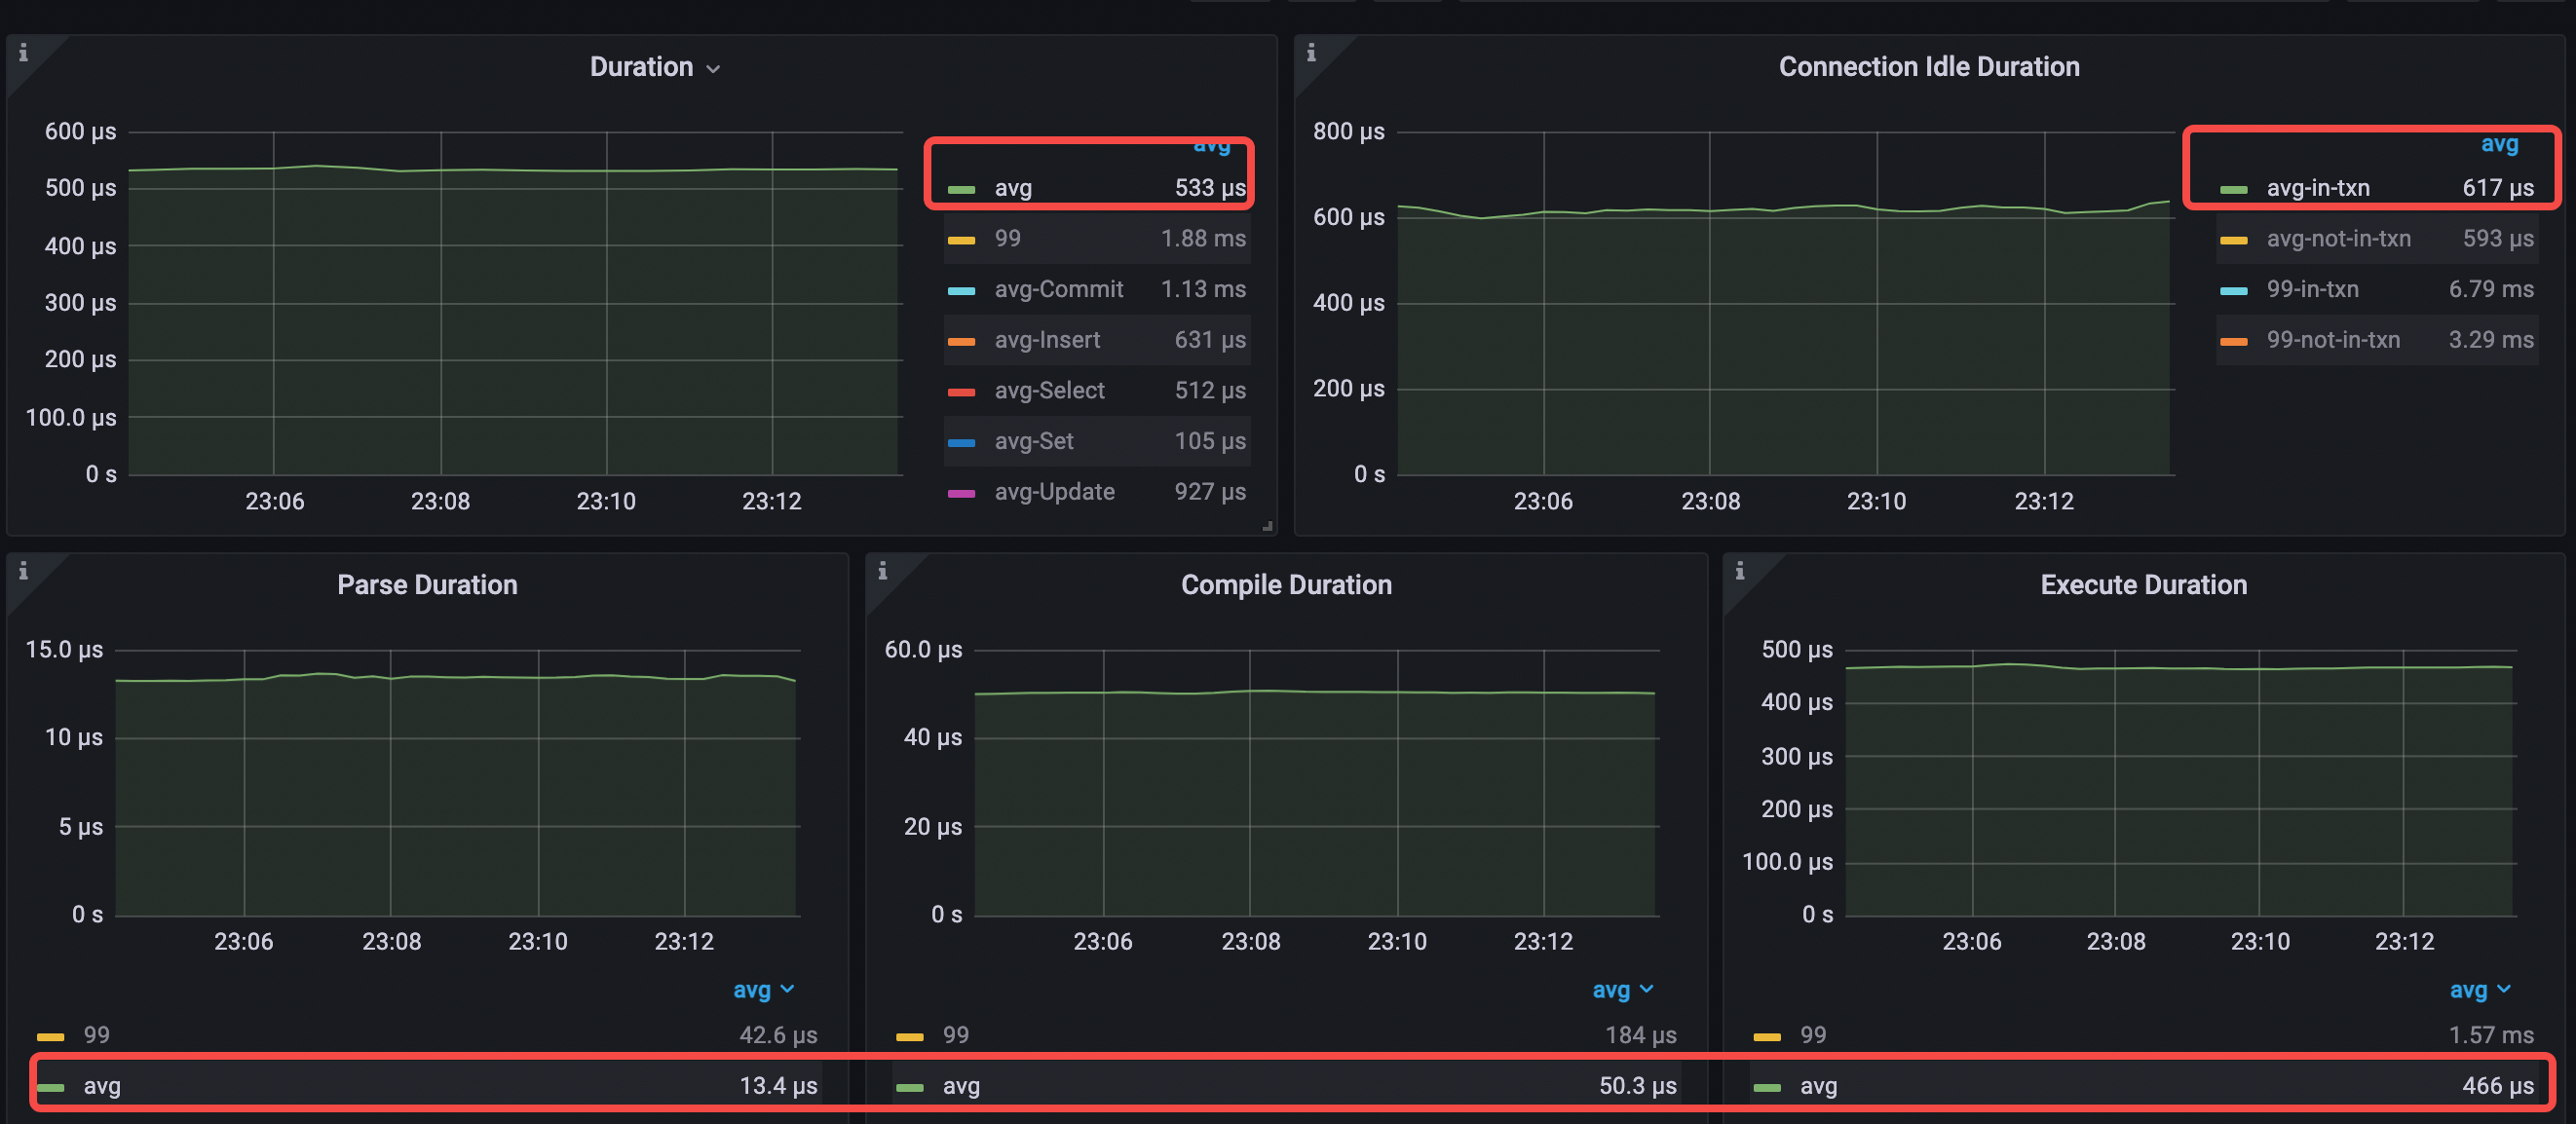
- avg query duration = 533μs (from 690μs to 533μs)
- avg parse duration = 13.4μs (from 13.5μs to 13.4μs )
- avg compile duration = 50.3μs (from 49.7μs to 50.3μs)
- avg execution duration = 466μs (from 623μs to 466μs)
- avg pd tso wait duration = 171μs (from 196μs to 171μs)
Analysis conclusion
After enabling RC Read by set global tidb_rc_read_check_ts=on;, RC Read significantly reduces the times of tso cmd, thus reducing tso wait and average query duration, and improving QPS.
The bottlenecks of both current database time and latency are in the execute phase, in which the Get and Cop read requests take the highest percentage. Most of the tables in this workload are read-only or rarely modified, so you can use the small table caching feature supported since TiDB v6.0.0 to cache the data of these small tables and reduce the waiting time and resource consumption of KV read requests.
Scenario 7: Use the small table cache
Application configuration
Compared with Scenario 6, the application configuration remains the same. The only difference is that Scenario 7 uses SQL statements such as alter table t1 cache; to cache those read-only tables for the business.
Performance analysis
TiDB Dashboard
The flame chart of the TiDB CPU does not have any significant changes.

Performance Overview dashboard
The QPS increases from 34.9k to 40.9k, and the KV request types take the most time in the execute phase change to Prewrite and Commit. The database time consumed by Get per second decreases from 5.33 seconds to 1.75 seconds, and the database time consumed by Cop per second decreases from 3.87 seconds to 1.09 seconds.
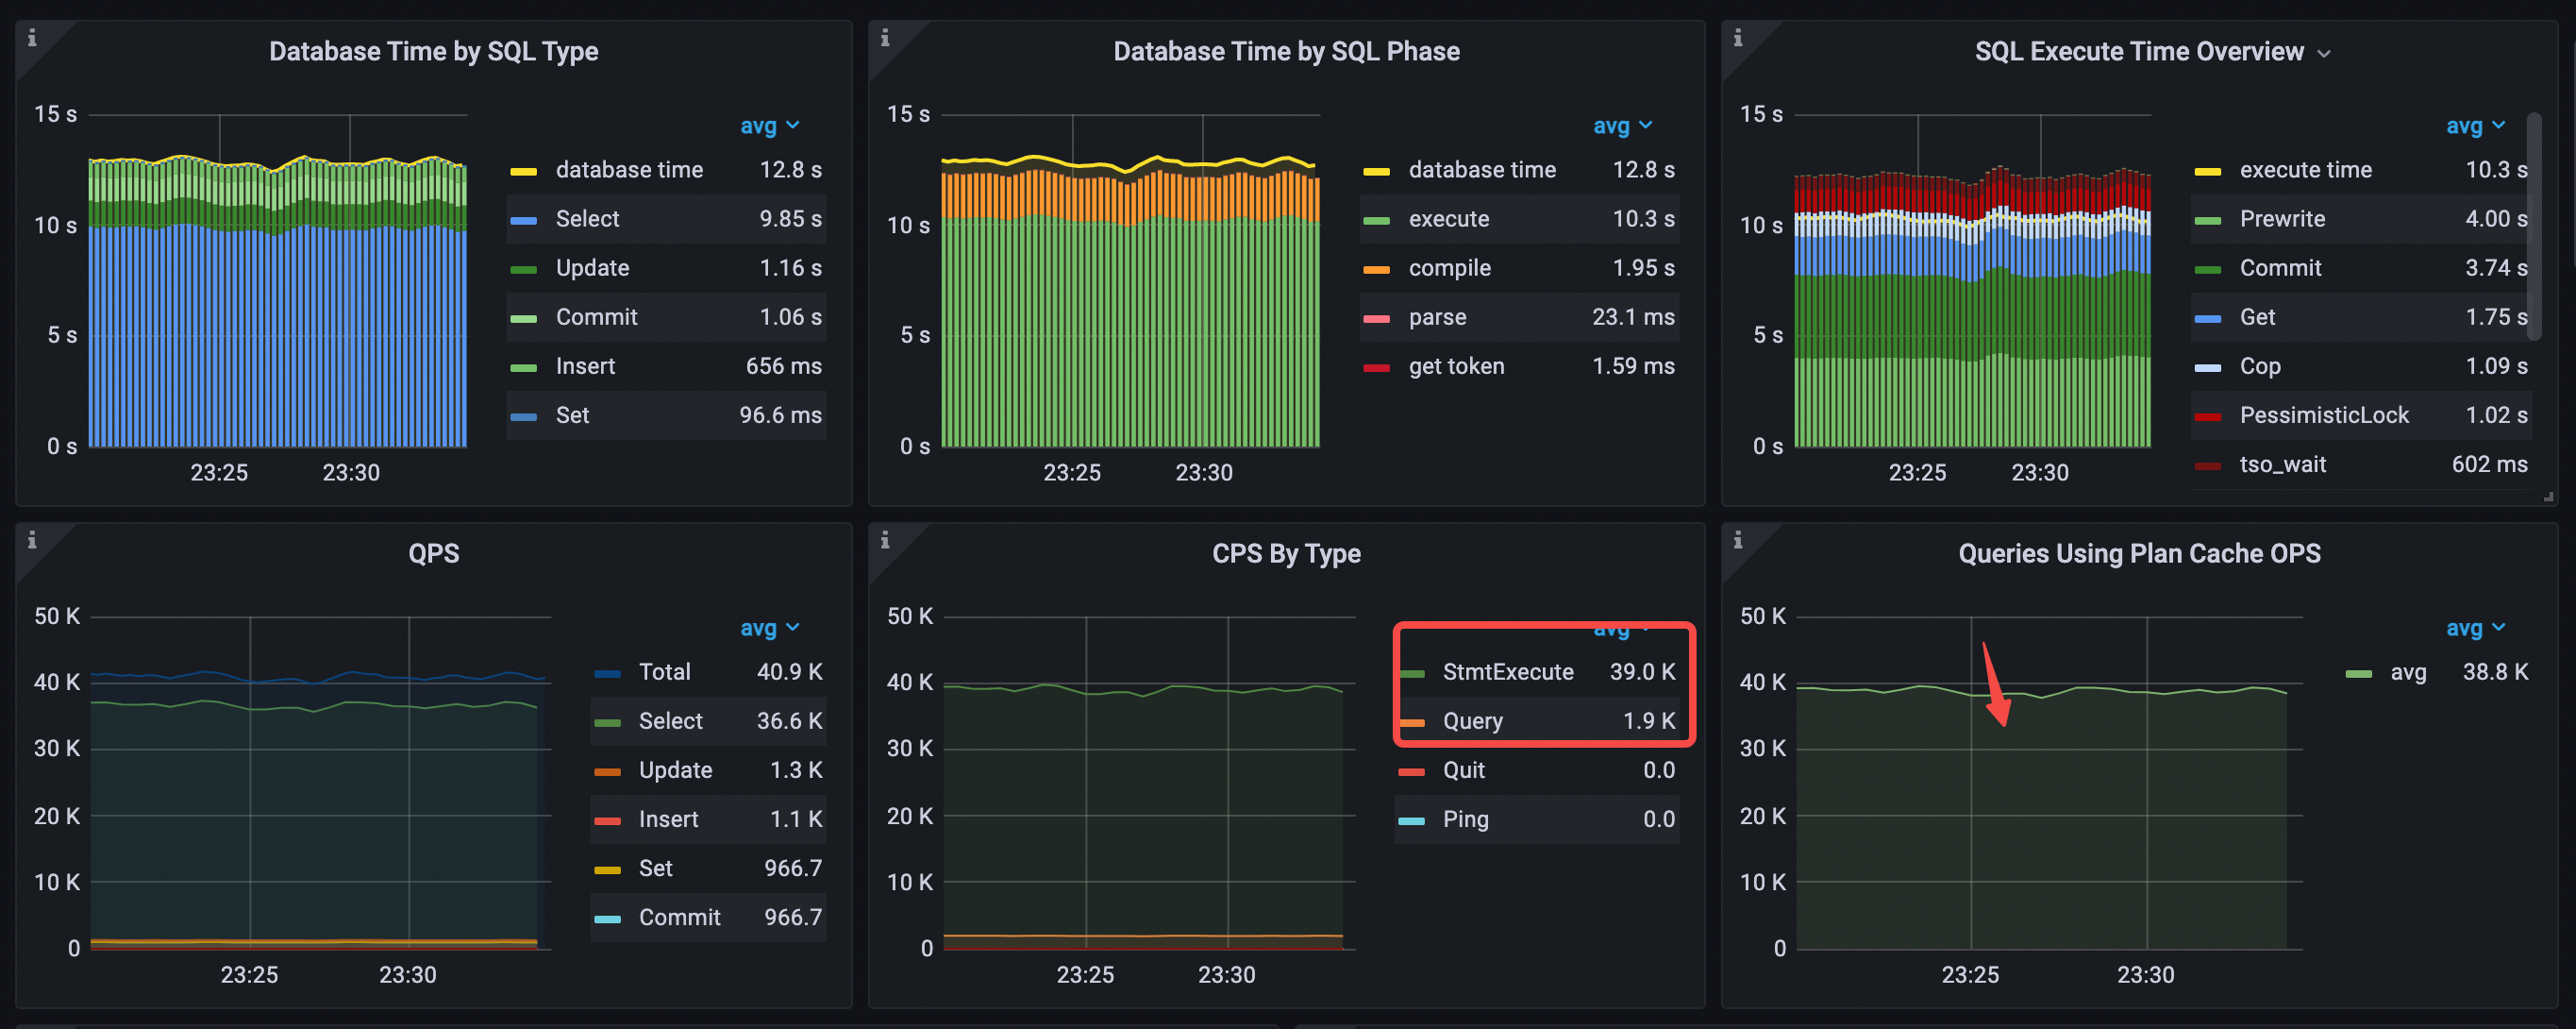
- Database Time by SQL Type: the
Selectstatement type takes most of the time. - Database Time by SQL Phase: the
executeandcompilephases take most of the time. - SQL Execute Time Overview:
Prewrite,Commit, andGettake most of the time. - Execution plan cache is hit. The value of Queries Using Plan Cache OPS roughly equals
StmtExecuteper second. - CPS By Type: only the
StmtExecutecommand is used. - avg QPS = 40.9k (from 34.9k to 40.9k)
The average TiDB CPU utilization drops from 603% to 478% and the average TiKV CPU utilization drops from 346% to 256%.

The average query latency drops from 533 us to 313 us. The average execute latency drops from 466 us to 250 us.
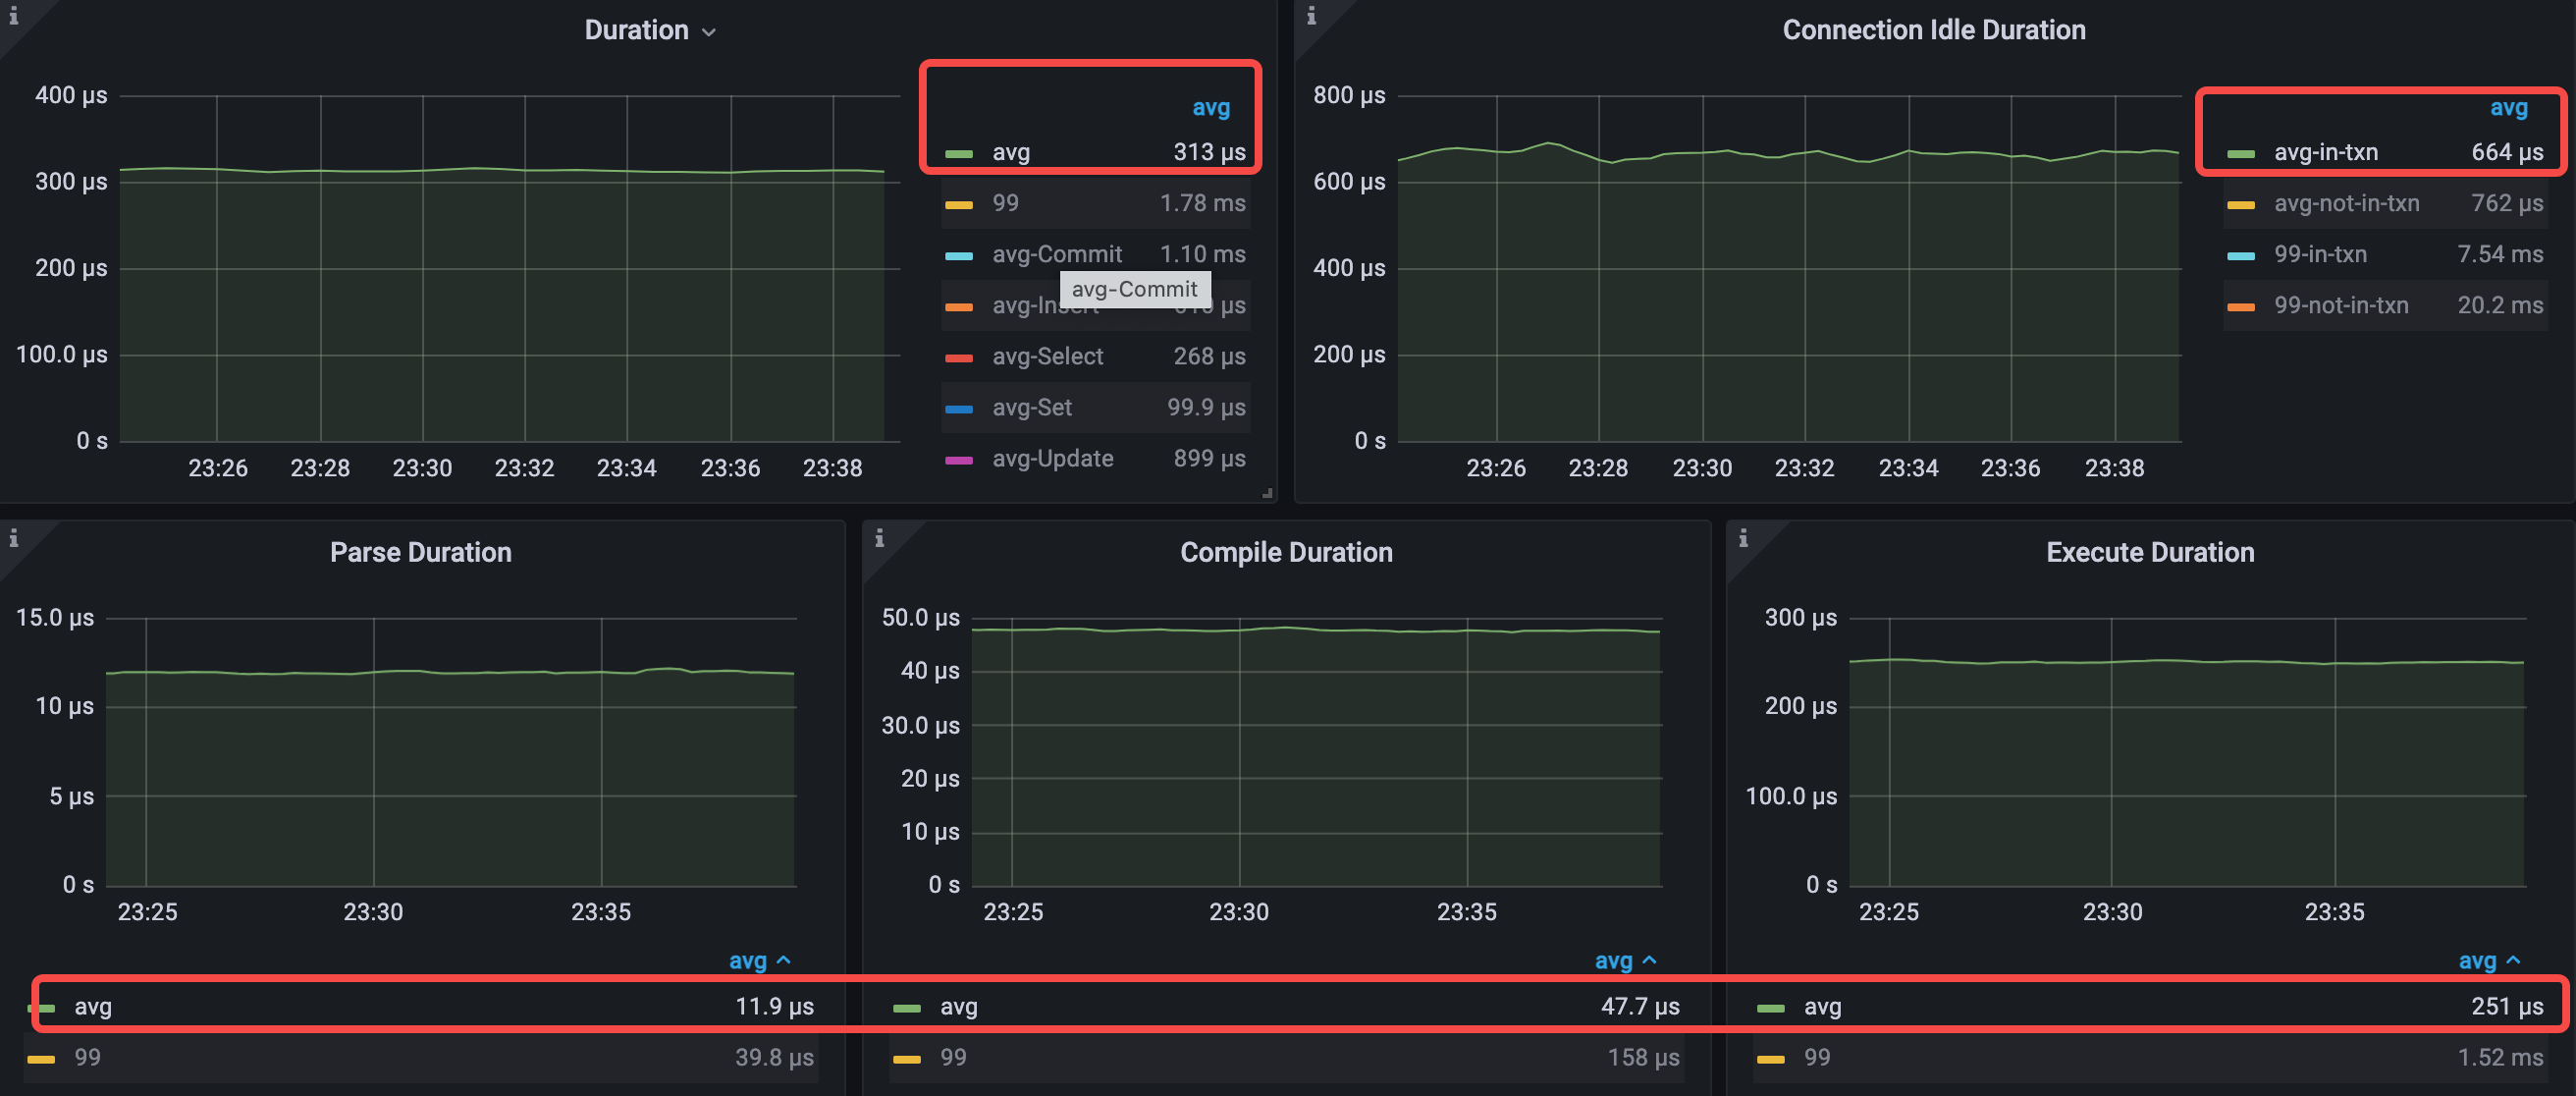
- avg query duration = 313μs (from 533μs to 313μs)
- avg parse duration = 11.9μs (from 13.4μs to 11.9μs)
- avg compile duration = 47.7μs (from 50.3μs to 47.7μs)
- avg execution duration = 251μs (from 466μs to 251μs)
Analysis conclusion
After caching all read-only tables, the Execute Duration drops significantly because all read-only tables are cached in TiDB and there is no need to query data in TiKV for those tables, so the query duration drops and the QPS increases.
This is an optimistic result because data of read-only tables in actual business might be too large for TiDB to cache them all. Another limitation is that although the small table caching feature supports write operations, the write operation requires a default wait of 3 seconds to ensure that the cache of all TiDB nodes is invalidated first, which might not be feasible to applications with strict latency requirements.
Summary
The following table lists the performance of seven different scenarios.
| Metrics | Scenario 1 | Scenario 2 | Scenario 3 | Scenario 4 | Scenario 5 | Scenario 6 | Scenario 7 | Comparing Scenario 5 with Scenario 2 (%) | Comparing Scenario 7 with Scenario 3 (%) |
|---|---|---|---|---|---|---|---|---|---|
| query duration | 479μs | 1120μs | 528μs | 426μs | 690μs | 533μs | 313μs | -38% | -51% |
| QPS | 56.3k | 24.2k | 19.7k | 22.1k | 30.9k | 34.9k | 40.9k | +28% | +108% |
In these scenarios, Scenario 2 is a common scenario where applications use the Query interface, and Scenario 5 is an ideal scenario where applications use the Prepared Statement interface.
- Comparing Scenario 2 with Scenario 5, you can see that by using best practices for Java application development and caching Prepared Statement objects on the client side, each SQL statement requires only one command and database interaction to hit the execution plan cache, which results in a 38% drop in query latency and a 28% increase in QPS, while the average TiDB CPU utilization drops from 936% to 577%.
- Comparing Scenario 2 with Scenario 7, you can see that with the latest TiDB optimization features such as RC Read and small table cache on top of Scenario 5, latency is reduced by 51% and QPS is increased by 108%, while the average TiDB CPU utilization drops from 936% to 478%.
By comparing the performance of each scenario, we can draw the following conclusions:
The execution plan cache of TiDB plays a critical role in the OLTP performance tuning. The RC Read and small table cache features introduced from v6.0.0 also play an important role in the further performance tuning of this workload.
TiDB is compatible with different commands of the MySQL protocol. When using the Prepared Statement interface and setting the following JDBC connection parameters, the application can achieve its best performance:
useServerPrepStmts=true&cachePrepStmts=true&prepStmtCacheSize=1000&prepStmtCacheSqlLimit=20480&useConfigs= maxPerformanceIt is recommended that you use TiDB Dashboard (for example, the Top SQL feature and Continuous Profiling feature) and Performance Overview dashboard for performance analysis and tuning.
- With the Top SQL feature, you can visually monitor and explore the CPU consumption of each SQL statement in your database during execution to troubleshoot database performance issues.
- With Continuous Profiling, you can continuously collect performance data from each instance of TiDB, TiKV, and PD. When applications use different interfaces to interact with TiDB, the difference in the CPU consumption of TiDB is huge.
- With Performance Overview Dashboard, you can get an overview of database time and SQL execution time breakdown information. You can analyze and diagnose performance based on database time to determine whether the performance bottleneck of the entire system is in TiDB or not. If the bottleneck is in TiDB, you can use the database time and latency breakdowns, along with load profile and resource usage, to identify performance bottlenecks within TiDB and tune the performance accordingly.
With a combination usage of these features, you can analyze and tune performance for real-world applications efficiently.